
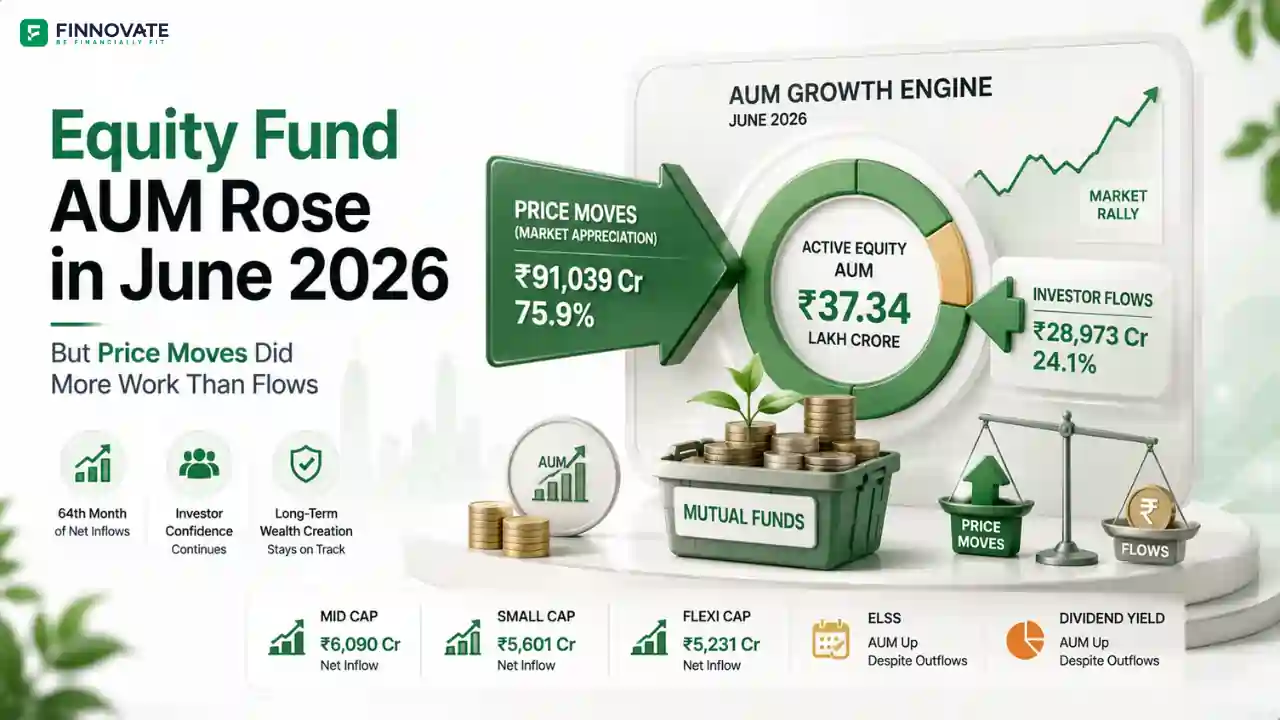
Equity Fund AUM June 2026: Price Moves Did More Work Than Flows
Active equity fund AUM rose 3.3% to ₹37.34 lakh crore in June 2026. Price accretion of �...
15 July 2026

Data period: Month ending May 30, 2026 | Source: AMFI monthly data
In March 2026, falling prices drove AUM lower. In April, rising prices drove AUM higher. May 2026 was different: flows did the heavy lifting, while price moves played a limited supporting role. Total open-ended mutual fund AUM dipped 0.40% to ₹81.39 trillion, with net outflows of ₹0.63 trillion partially offset by ₹0.30 trillion of price accretion.
Quick read: Active equity funds received net inflows of ₹22,908 crore in May 2026, down 40.4% from April. Despite lower flows, inflows contributed more to AUM change than price moves: price dominance in active equity was just 41.8%. Within equity, mid-cap and small-cap funds led on both flows and price performance. Large-cap and flexi-cap funds saw negative price accretion. Passive funds had 94.8% price dominance largely due to gold ETF price gains with minimal flows.
| Fund Category | AUM Change (₹ trillion) | Price Accretion (₹ trillion) | Net Flows (₹ trillion) | Price Dominance |
|---|---|---|---|---|
| Equity Funds | +₹0.39 trillion | +₹0.16 trillion | +₹0.23 trillion | 41.8% |
| Debt Funds | -₹0.89 trillion | +₹0.08 trillion | -₹0.97 trillion | Low |
| Passive Funds | Modest change | Positive | Flows dried up | 94.8% |
| Hybrid Funds | Modest change | Negative | Positive (exceeded AUM accretion) | Negative |
| Total Open-Ended AUM | -₹0.33 trillion (-0.40%) | +₹0.30 trillion | -₹0.63 trillion | Overall mixed |
Active equity funds received net inflows of ₹22,908 crore in May 2026, down 40.4% from April. Total AUM accretion across active equity was ₹39,366 crore, with ₹22,908 crore from net inflows and ₹16,459 crore from price accretion. Price dominance across active equity as a whole was 41.8%.
| Fund Category | Net Inflow (₹ crore) | AUM Closing (₹ crore) | Total AUM Accretion (₹ crore) | Price Accretion (₹ crore) | Price Dominance |
|---|---|---|---|---|---|
| Large Cap Fund | 1,592.93 | 3,97,060.82 | -1,773.91 | -3,366.84 | 189.80% |
| Value / Contra Fund | 509.57 | 2,10,504.18 | -976.27 | -1,485.84 | 152.20% |
| Sectoral / Thematic Funds | 647.87 | 5,35,187.18 | 4,956.92 | 4,309.06 | 86.93% |
| Mid Cap Fund | 4,385.06 | 4,87,793.68 | 12,782.18 | 8,397.12 | 65.69% |
| Small Cap Fund | 4,945.57 | 4,04,379.58 | 11,607.40 | 6,661.83 | 57.39% |
| Dividend Yield Fund | -97.46 | 31,305.62 | -213.35 | -115.89 | 54.32% |
| ELSS | -650.78 | 2,36,446.07 | -1,268.75 | -617.98 | 48.71% |
| Multi Cap Fund | 2,291.01 | 2,32,886.94 | 4,195.52 | 1,904.51 | 45.39% |
| Large and Mid Cap Fund | 3,278.22 | 3,39,999.87 | 4,781.79 | 1,503.57 | 31.44% |
| Focused Fund | 830.25 | 1,74,258.49 | 745.09 | -85.16 | -11.43% |
| Flexi Cap Fund | 5,175.54 | 5,63,895.97 | 4,529.66 | -645.88 | -14.26% |
| Active Equity Total | 22,907.77 | 36,13,718.41 | 39,366.28 | 16,458.51 | 41.81% |
Price dominance measures how much of the AUM change in a month was driven by market price movement versus investor flows. A reading above 100% in a negative AUM month means price falls drove the decline more than outflows. A reading below 50% means flows were the bigger force.
Mid-cap funds received ₹4,385 crore in net inflows and generated ₹8,397 crore in positive price accretion. Small-cap funds received ₹4,946 crore in net inflows and ₹6,662 crore in price accretion. Both categories delivered positive AUM growth driven by both investor appetite and underlying market performance. This is consistent with the Nifty Mid-Cap 100's outperformance in May 2026, when the index hit a new 52-week high even as large-caps declined.
Large-cap funds received ₹1,593 crore in positive inflows but saw price accretion of negative ₹3,367 crore, pushing total AUM lower by ₹1,774 crore. The price dominance of 189.8% reflects that negative price moves were almost double the total AUM decline, though positive inflows cushioned but could not offset the price fall. This is the Kurtosis effect: large-cap indices are more concentrated in stocks that bore the brunt of FPI selling in May 2026. Flexi-cap funds attracted ₹5,176 crore in inflows but saw ₹646 crore in price depletion, resulting in a -14.3% price dominance. Their large-cap heavy composition was the drag.
Passive funds registered 94.8% price dominance in May 2026, not because market returns were strong across the board, but because flows into passive funds nearly dried up and gold ETF prices rose sharply. When flows are low and one component (gold) delivers strong price gains, price dominance mechanically inflates. This is not a sign of broad passive market strength; it is a gold-driven reading in a month of thin passive fund flows.
Debt funds saw AUM fall ₹0.89 trillion in May 2026. Price accretion of ₹0.08 trillion provided a partial offset, but net outflows of ₹0.97 trillion drove the decline. Debt fund AUM is significantly affected by institutional and corporate flows at month-end and quarter-end; May outflows likely reflect portfolio repositioning rather than a structural shift away from debt.
The flow pattern in May 2026, with mid-cap, small-cap, multi-cap, and large-and-mid-cap funds attracting the largest positive inflows, suggests investors are gravitating toward a mix of alpha-seeking exposure and allocation diversification. The preference for mid and small caps over large caps mirrors the broader market trend where domestically-oriented segments outperformed globally-exposed large-caps in May 2026.
Flexi-cap funds attracted the highest absolute inflows (₹5,176 crore) among all equity categories, yet delivered negative price returns due to their large-cap skew. This gap between inflow preference and price performance in flexi-caps is a signal worth watching: investors are still allocating to the category on the basis of its mandate flexibility, even as its large-cap exposure is a current performance drag.
The FinnFit Financial Fitness Test takes 3 minutes and shows you whether your mutual fund allocation is balanced across market cap segments, risk categories, and your own financial goals.
Take the FinnFit TestPrice dominance measures what percentage of a fund category's AUM change in a given month was caused by market price movements rather than investor flows. A reading of 60% means price moves drove 60% of the AUM change and flows drove 40%. Above 100% in a negative AUM month means price falls were a larger force than net outflows. Negative price dominance means prices moved against the flow direction.
Debt funds saw net outflows of approximately ₹0.97 trillion in May 2026, which overwhelmed the positive equity fund inflows and price accretion elsewhere. Debt fund outflows at month-end often reflect institutional and corporate portfolio repositioning rather than a structural shift. The equity segment itself saw positive AUM accretion of ₹39,366 crore.
Large-cap funds received ₹1,593 crore in positive inflows but saw price accretion of negative ₹3,367 crore. Large-cap indices in May 2026 bore the brunt of FPI selling and MSCI EM weight-related passive outflows, which concentrated in the most liquid large-cap stocks. Positive retail and SIP inflows could not offset the price drag from institutional selling.
Flexi-cap funds attracted the highest absolute inflows among equity categories (₹5,176 crore) but delivered negative price accretion of ₹646 crore due to their large-cap-heavy portfolio construction. This is not a structural problem with the category; it reflects the specific May 2026 market environment where large-caps underperformed. Flexi-cap funds retain the mandate to shift allocation across market caps, but only if the fund manager exercises that discretion. Past performance is not indicative of future returns.
Passive fund price dominance of 94.8% in May 2026 was driven by gold ETF price gains in a month when flows into passive funds nearly dried up. When flows are near zero and gold prices rise, price accretion mathematically dominates the AUM change. This reading does not indicate broad passive market strength; it is a gold-specific phenomenon in a low-flow month.
Disclaimer: This article is for general information and educational purposes only. It does not constitute investment advice, a recommendation, or an offer to buy or sell any securities or financial instruments. All AUM and flow data referenced in this article is sourced from AMFI's publicly available monthly data for May 2026. Price dominance calculations are derived from AMFI data. Past performance of mutual fund categories is not indicative of future returns. Mutual fund investments are subject to market risks. Please read all scheme-related documents carefully and consult a SEBI-registered investment adviser before making any investment decision.
No spam. Only new posts, simple explainers, and practical money checklists for busy professionals.
Finnovate is a SEBI-registered financial planning firm that helps professionals bring structure and purpose to their money. Over 3,500+ families have trusted our disciplined process to plan their goals - safely, surely, and swiftly.
Our team constantly tracks market trends, policy changes, and investment opportunities like the ones featured in this Weekly Capsule - to help you make informed, confident financial decisions.
Learn more about our approach and how we work with you:
No comments yet. Start the conversation. What would you add?
No spam. Only new posts, simple explainers, and practical money checklists.
You may also like
Active equity fund AUM rose 3.3% to ₹37.34 lakh crore in June 2026. Price accretion of �...

Passive fund inflows rebounded to ₹16,724 crore in June 2026, with gold and silver ETFs ...

Equity fund folios grew 22.96% CAGR and AUM 29.69% over 3 years. See which of the 11 categ...

Passive fund net inflows hit just ₹362 crore in May 2026 despite 33% folio and 25% AUM g...
Popular now

Learn how to easily download your NSDL CAS Statement in PDF format with our step-by-step g...

Learn what SIF investment means in India, SEBI rules, Rs 10 lakh minimum investment, avail...

Looking for the best financial freedom books? Here’s a handpicked 2026 reading list with...

Clear guide to mutual fund taxation in India for FY 2025–26 after July 2024 changes: equ...