

Nifty Midcap 100 June 2026: Top Mid-Cap Stock Rankings
Nifty Midcap 100 bounced 19.8% from its yearly lows in June 2026, closing near its 52-week...
10 July 2026
Data period: Month ending May 30, 2026
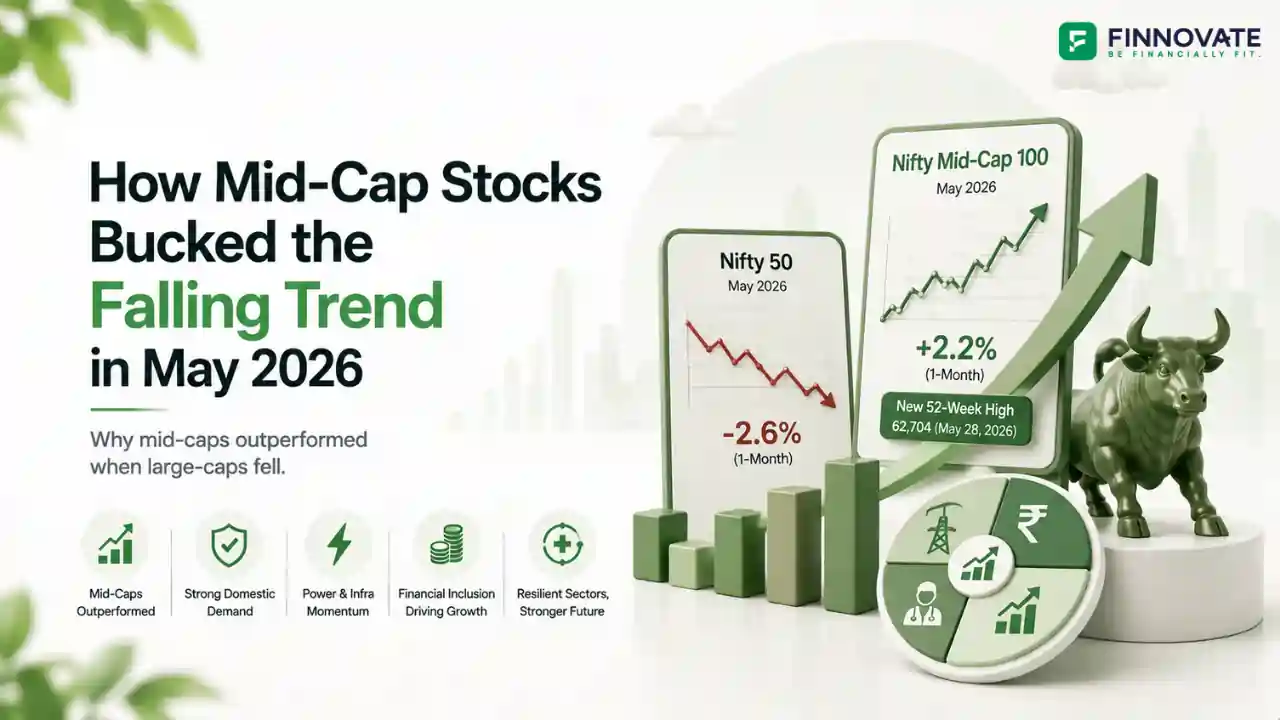
In May 2026, the Nifty 50 declined approximately 2.6% month-on-month while the Nifty Mid-Cap 100 rose approximately 2.2% over the same period. That near 5 percentage point divergence between large-caps and mid-caps in a single month is unusual and worth examining carefully. The Nifty Mid-Cap 100 also hit a new 52-week high of 62,704 on May 28, even as the Nifty 50 remained down approximately 5.2% year-on-year.
Mid-caps outperformed because they were less exposed to the forces that weighed on large-caps in May: FPI outflows linked to MSCI EM index rebalancing, oil price volatility from the Middle East conflict, and rupee pressure. Mid-cap businesses, with their more focused domestic models, absorbed less of this external pressure. Within the mid-cap space, select themes drove the outperformance more sharply. This report presents Finnovate's four-factor ranking model for the top 20 Nifty Mid-Cap 100 stocks for May 2026.
Quick read: Power equipment stocks dominated the top-20 with five constituents (Hitachi Energy India, BHEL, GE Vernova T&D, Polycab, KEI), driven by domestic infrastructure demand. Financial inclusion names, metals, energy, telecom, and healthcare also featured. The top-20 delivered an average 1-month return of 13.6% and average 1-year return of 58.5% against a Nifty 50 that was down year-on-year.
| Index | 1-Month Return (May 2026) | 1-Year Return | 52-Week High Status |
|---|---|---|---|
| Nifty 50 | -2.6% (approx.) | -5.2% (approx.) | Down ~5.2% year-on-year |
| Nifty Mid-Cap 100 | +2.2% (approx.) | +7.4% (approx.) | New 52-week high hit May 28, 2026 |
The combined rank is the average of four individual ranks, each capturing a different dimension of stock performance. Lower combined rank score means better overall positioning.
| Company | 1-Month Return | 1-Year Return | Bounce From Low | Distance to Peak | Combined Rank Score |
|---|---|---|---|---|---|
| LAURUSLABS | 24.62% | 125.07% | 126.33% | 1.54% | 3.00 |
| IDEA | 37.18% | 102.60% | 129.08% | 2.91% | 4.00 |
| POWERINDIA (Hitachi Energy India) | 14.28% | 98.67% | 137.97% | 0.79% | 4.75 |
| BHEL | 17.89% | 59.89% | 102.54% | 2.22% | 7.00 |
| GVT&D (GE Vernova T&D India) | 11.95% | 123.07% | 127.75% | 4.25% | 8.00 |
| POLYCAB | 17.00% | 58.40% | 64.75% | 2.64% | 9.50 |
| SAIL | 10.49% | 57.91% | 72.73% | 2.72% | 10.00 |
| NATIONALUM | 5.71% | 134.04% | 139.37% | 5.18% | 11.25 |
| BSE | 14.23% | 55.51% | 105.71% | 6.49% | 13.50 |
| ABCAPITAL | 5.35% | 63.59% | 66.64% | 3.18% | 14.25 |
| KEI | 8.80% | 46.39% | 51.00% | 3.49% | 15.25 |
| BIOCON | 20.08% | 28.58% | 31.82% | 1.94% | 17.00 |
| TATACOMM | 24.01% | 16.93% | 48.20% | 4.39% | 17.00 |
| BHARATFORG | 3.85% | 57.47% | 77.56% | 4.40% | 17.00 |
| ATGL | 22.36% | 13.58% | 67.80% | 9.68% | 22.00 |
| JSWENERGY | 6.57% | 22.55% | 39.80% | 3.13% | 22.25 |
| RADICO | 3.12% | 39.37% | 43.76% | 4.05% | 22.75 |
| INDUSTOWER | 8.23% | 15.50% | 41.96% | 7.85% | 25.50 |
| YESBANK | 16.41% | 8.01% | 34.88% | 4.53% | 26.00 |
| FEDERALBNK | 0.44% | 42.63% | 55.69% | 4.57% | 26.25 |
Average 1-month return
across top-20 stocks
Average 1-year return
across top-20 stocks
Average bounce from
52-week low
Average distance from
52-week peak
Reading the rankings by sector reveals five distinct themes driving mid-cap outperformance in May 2026.
| Theme | Key Stocks in Top 20 | Driver | Signal |
|---|---|---|---|
| Power equipment dominated | Hitachi Energy India (POWERINDIA), BHEL, GE Vernova T&D (GVT&D), Polycab, KEI | Domestic infrastructure spending and grid expansion have created predictable, less cyclical demand for power equipment and cable companies. These names are domestic proxies for India's capex cycle and are insulated from global risk-off selling. | Dominant theme: 5 of 20 |
| Financial inclusion space | BSE, Aditya Birla Capital (ABCAPITAL), Yes Bank, Federal Bank | Rate hikes anticipated by market participants are expected to improve NIM spreads for NBFCs and smaller banks with liability advantages. BSE outperformed on rising trading volumes driven by increased retail participation in a volatile market. | Tactical positioning: 4 of 20 |
| Metals and energy on geopolitical tailwinds | SAIL, National Aluminium (NATIONALUM), Adani Total Gas (ATGL), JSW Energy | The Middle East conflict has created direct commodity pricing and supply tailwinds for both metal producers and gas distributors. Prices have trended upward through May 2026, directly benefiting these names. | Geopolitical beneficiaries: 4 of 20 |
| Telecom as defensive exposure | Tata Communications (TATACOMM), Vodafone Idea (IDEA), Indus Towers (INDUSTOWER) | Telecom names were seen as defensive bets amid global uncertainty, with domestic revenue visibility and recurring subscription income. Vodafone Idea's strong 1-month and 1-year returns reflect continued turnaround momentum. | Defensive rotation: 3 of 20 |
| Healthcare defensives | Laurus Labs (LAURUSLABS), Biocon | Both stocks led the combined ranking. Healthcare names with strong 1-year recovery stories and proximity to 52-week highs attracted capital rotation from global uncertainty. Laurus Labs topped the overall ranking with a combined rank score of 3.00. | Top-ranked theme: 2 of 20 |
The structural explanation for mid-cap outperformance in May 2026 runs through three specific differences between how mid-caps and large-caps are exposed to the current macro environment.
FPI selling, which drove the Nifty 50 down in May, predominantly impacts large-cap stocks. FPIs hold significant positions in Nifty 50 heavyweights (financials, IT, energy) and their selling pressure flows through index weights directly into large-cap prices. Mid-caps have far lower FPI ownership on average, making them structurally less sensitive to the same selling wave.
The MSCI EM index rebalancing that reduced India's weight in April and May 2026 specifically affects stocks with sufficient free-float and liquidity to be held by passive index funds. Most mid-cap stocks do not qualify for significant MSCI EM passive fund ownership. The mechanical selling that hit Nifty 50 constituents around the May 29 rebalancing date simply did not apply to the mid-cap universe in the same way.
The sector composition of the mid-cap index is more domestically oriented than the large-cap index. Infrastructure, power, financial inclusion, and domestic consumption dominate the mid-cap space. These are businesses driven by India's internal capex cycle and domestic demand, not by global risk appetite or FPI sentiment. In an environment where global macro was negative but domestic demand indicators remained supportive, mid-caps had a structural tailwind that large-caps did not.
For context on the FPI selling and MSCI rebalancing dynamics that shaped the May 2026 large-cap environment, see our analysis of FPI Outflows in March 2026 and FPI Flows January 2026.
The May 2026 data shows how differently large-caps and mid-caps can perform in the same market environment. The FinnFit Financial Fitness Test takes 3 minutes and shows you where your portfolio stands across market cap segments, risk exposure, and goal alignment.
Take the FinnFit TestThree structural factors drove the divergence. FPI selling and MSCI EM index rebalancing primarily impact large-cap stocks with higher foreign ownership. Mid-cap companies have more domestically focused business models, making them less sensitive to global risk-off conditions and currency pressures. In May 2026, the sectors dominating mid-cap rankings (infrastructure, power equipment, and domestic financials) were directly supported by India's internal capex cycle.
Power equipment was the dominant sector, with five stocks in the top 20: Hitachi Energy India, BHEL, GE Vernova T&D India, Polycab, and KEI. These companies benefit from India's grid expansion programme and domestic infrastructure spending, which provide more predictable demand patterns compared with globally exposed large-cap sectors.
The ranking model reflects past performance and current positioning across four dimensions. A top-ranked stock has shown strong momentum, recovery from lows, and proximity to its highs, but this reflects historical performance, not a forward recommendation. Past rankings are not indicative of future returns. Please consult a SEBI-registered investment adviser before making any investment decision based on this data.
Distance to peak measures the percentage gap between a stock's current price and its 52-week high. A low distance to peak means the stock is trading close to its yearly high, indicating sustained buying interest and reduced selling pressure from investors sitting on earlier gains. Across the top-20 mid-cap stocks in May 2026, the average distance to peak was just 4.0%, confirming these stocks were broadly at or near their cycle highs.
Mid-cap stocks generally carry higher volatility and liquidity risk than large-cap stocks. They can outperform sharply in favourable conditions (as in May 2026) but can also underperform more severely during broad market stress or liquidity crunches. The same structural characteristics that insulated mid-caps from FPI selling in May 2026 can work in reverse when domestic demand slows or risk appetite contracts sharply. Portfolio allocation across market cap segments should reflect individual risk tolerance and investment horizon. Please consult a SEBI-registered investment adviser for guidance specific to your situation.
Disclaimer: This article is for general information and educational purposes only. It does not constitute investment advice, a recommendation, or an offer to buy or sell any securities or financial instruments. Rankings and return data are based on publicly available NSE price data for the month ending May 30, 2026. Index return and 52-week high figures are sourced from publicly available market data. Past performance is not indicative of future returns. Please consult a SEBI-registered investment adviser or qualified financial professional before making any investment decision. Equity investments are subject to market risks. Please read all scheme-related documents carefully before investing.
No spam. Only new posts, simple explainers, and practical money checklists for busy professionals.
Finnovate is a SEBI-registered financial planning firm that helps professionals bring structure and purpose to their money. Over 3,500+ families have trusted our disciplined process to plan their goals - safely, surely, and swiftly.
Our team constantly tracks market trends, policy changes, and investment opportunities like the ones featured in this Weekly Capsule - to help you make informed, confident financial decisions.
Learn more about our approach and how we work with you:
No comments yet. Start the conversation. What would you add?
No spam. Only new posts, simple explainers, and practical money checklists.
You may also like
Nifty Midcap 100 bounced 19.8% from its yearly lows in June 2026, closing near its 52-week...

Nifty rose 2.95% in June 2026 but is down 5.02% year-on-year. Shriram Finance ranked #1 wi...

Both GIFT City IFSC and direct LRS use the same USD 250,000 annual limit. The real differe...

SEBI's June 2026 interim order alleges ₹15.15 lakh crore revenue misrepresentation at Ra...
Popular now

Learn how to easily download your NSDL CAS Statement in PDF format with our step-by-step g...

Learn what SIF investment means in India, SEBI rules, Rs 10 lakh minimum investment, avail...

Looking for the best financial freedom books? Here’s a handpicked 2026 reading list with...

Clear guide to mutual fund taxation in India for FY 2025–26 after July 2024 changes: equ...