

EU Scrap Export Curbs: India’s Raw-Material Risk Explained
Proposed EU scrap export curbs could affect India’s metal supply and manufacturing costs...
24 September 2026
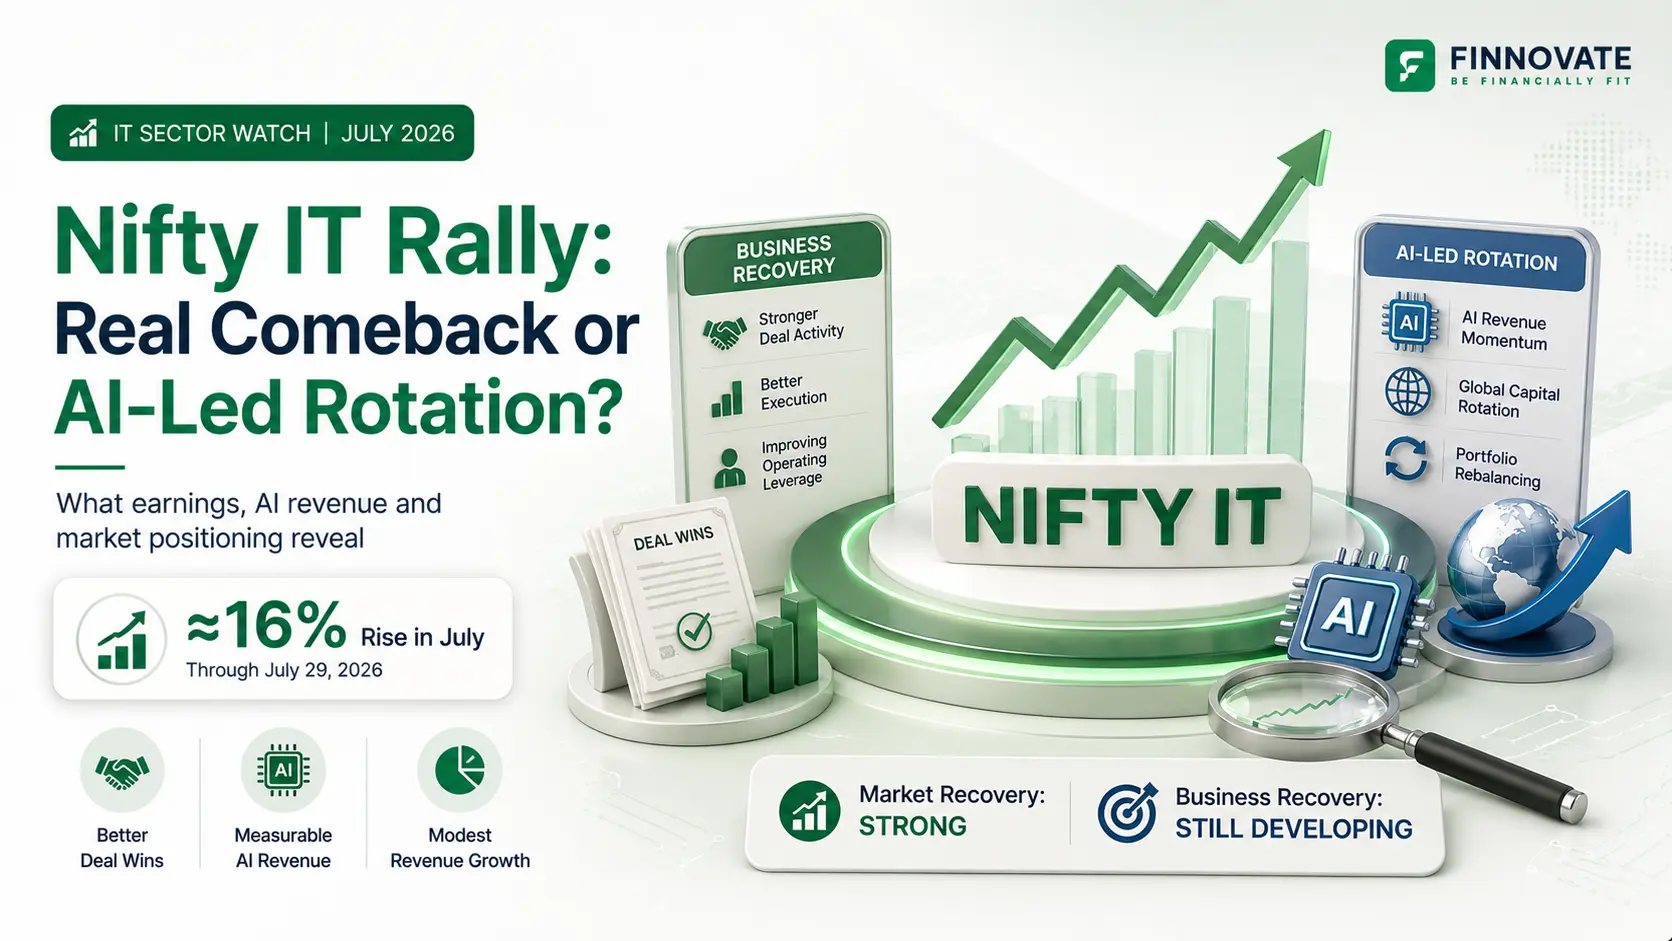
Indian information technology stocks entered July 2026 as one of the weakest parts of the equity market. By the close on July 29, the same sector had become one of the month’s strongest performers.
The Nifty IT index closed at 31,123.10 on July 29 after rising 2.32% during the session. Its month-to-date gain stood at approximately 16%, even though foreign institutional investors had reduced their holdings in seven of the index’s ten constituents during the June quarter.
The turnaround raises an important question: has the operating outlook for Indian IT genuinely improved, or is the market recovering from excessive pessimism while global investors rotate away from crowded AI-hardware trades?
The evidence points to a combination of both.
Quarterly results showed stronger deal activity, measurable AI revenue and better execution at selected companies. However, revenue growth remained modest across much of the sector, guidance was cautious and the traditional outsourcing model continued to face pressure from AI-led productivity.
Before July began, investor sentiment towards Indian IT was unusually weak.
| Market indicator | Position |
|---|---|
| Nifty IT decline during the June quarter | Approximately 9.5% |
| Nifty IT decline in 2026 before July | Approximately 28% |
| Nifty IT close on July 29, 2026 | 31,123.10 |
| July month-to-date gain through July 29 | Approximately 16% |
| July 29 single-day gain | 2.32% |
| Reported 52-week high | Approximately 40,301 |
| Distance from 52-week high on July 29 | Approximately 23% lower |
The sector had entered the Q1 FY27 earnings season as India’s worst-performing major equity sector. Weak discretionary technology spending, uncertainty around AI disruption and expectations of prolonged revenue growth below 4% had weighed on valuations.
The July rebound is therefore significant, but it has not taken the index back to its previous high. It is more accurately described as a recovery from a deep correction than a complete reversal of the earlier decline.
The correction was driven by both cyclical and structural concerns.
Global enterprises remained cautious about discretionary technology projects. Longer decision cycles delayed the conversion of deal pipelines into revenue, while economic and geopolitical uncertainty affected spending in sectors such as telecom, consumer businesses and technology.
At the same time, AI created a more fundamental concern.
Indian IT companies traditionally earned a large part of their revenue by supplying teams for application development, maintenance, testing, infrastructure management and business-process services. Generative AI can automate parts of this work, reduce the number of employees required and shorten delivery timelines.
That creates possible pressure on:
Foreign investors responded by reducing exposure. FIIs cut their holdings in seven of the ten Nifty IT constituents during the June quarter, while the sector’s weight in the Nifty 50 had fallen to a multi-decade low.
Finnovate had earlier examined whether markets had overreacted to AI-driven disruption in Indian IT when the Anthropic-led sell-off intensified.
The earnings season weakened the most pessimistic argument against Indian IT, but it did not demonstrate a sector-wide growth boom.
| Company | Q1 FY27 revenue signal | Deal and AI signal | Interpretation |
|---|---|---|---|
| TCS | 0.4% sequential growth in constant currency | $9.5 billion TCV; annualised AI revenue of $2.6 billion | Stable demand and visible AI revenue, but limited total growth |
| Infosys | 1% sequential constant-currency growth | $3.6 billion large-deal TCV; AI at 8.2% of revenue | Better momentum, but FY27 guidance remains modest |
| HCLTech | 0.5% sequential constant-currency decline | $2.4 billion bookings; advanced AI revenue of $171 million | Strong bookings and AI growth despite quarterly seasonality |
| Tech Mahindra | 2.6% sequential constant-currency growth | $1.078 billion deal wins; EBIT margin of 14.4% | Improving turnaround and execution |
| Wipro | 1.2% sequential constant-currency decline | $1.626 billion large-deal bookings | Deal wins improved, but near-term revenue remains weak |
TCS reported quarterly revenue of $7.62 billion, 0.4% sequential constant-currency growth and a $9.5 billion order book. Its annualised AI-services revenue reached $2.6 billion, up 13.6% sequentially.
Infosys delivered 1% sequential constant-currency growth and $3.6 billion in large-deal wins, of which 61% was net new. AI represented 8.2% of quarterly revenue. The company revised its FY27 constant-currency revenue-growth guidance to 1.5%–3%, which remains constructive but far below the growth rates seen during stronger outsourcing cycles.
HCLTech recorded its highest-ever first-quarter net-new bookings at $2.4 billion. Advanced AI revenue reached $171 million, growing 62.1% year on year in constant currency. However, total constant-currency revenue declined 0.5% sequentially.
Tech Mahindra produced the strongest sequential growth among the five large companies, with constant-currency revenue rising 2.6%. Its deal wins reached $1.078 billion, while the EBIT margin improved to 14.4%.
Wipro remained weaker. IT-services revenue declined 1.2% sequentially in constant currency, and its second-quarter guidance ranged from a 1.5% decline to growth of only 0.5%. Large-deal bookings improved, but the revenue outlook continued to show that recovery is uneven.
The most important change in the earnings season was that AI moved from presentations and pilot projects into measurable revenue disclosures.
TCS disclosed a $2.6 billion annualised AI run rate. Infosys said AI contributed 8.2% of revenue. HCLTech disclosed $171 million of advanced-AI revenue.
These figures show that Indian IT companies are participating in:
This supports the opportunity side of India’s position across the global AI value chain.
However, company AI disclosures are not directly comparable.
TCS annualises quarterly AI revenue, Infosys reports AI as a proportion of total revenue and HCLTech separately reports advanced-AI revenue. These figures cannot be combined or used to create a standard sector growth rate.
There is also a deeper contradiction:
AI can increase technology-transformation spending while reducing the labour required to deliver each project.
Indian IT companies may win more AI-related work, but they may also face pressure on pricing, headcount and traditional billing models. The rally does not resolve that tension.
The July rebound suggests that investors may have priced the disruption risk too aggressively.
The earlier market view treated AI primarily as a substitute for outsourced technology services. Q1 results showed that large Indian vendors can also act as implementation partners, helping global companies integrate AI into complex existing systems.
Large enterprises still need support with:
These areas favour companies with established client relationships and experience managing large technology environments.
However, better AI revenue does not guarantee that the old outsourcing model will remain intact. Revenue per employee, project pricing and headcount trends will become increasingly important measures of whether AI creates profitable growth or simply replaces existing work.
The late-July rally also coincided with sharp selling in Asian semiconductor markets.
On July 28, Samsung Electronics fell 13.4% and SK Hynix dropped 14.7% as investors questioned high valuations, AI-infrastructure financing and rising competition from Chinese chipmakers. South Korea’s KOSPI fell 10.8% during the session.
Indian equities moved in the opposite direction on July 29. The Nifty 50 gained 1.1%, while Nifty IT rose 2.3%, taking its four-session advance to 9.1%. Reuters attributed part of the move to rotation away from crowded AI trades and towards markets with less direct exposure to expensive AI-hardware stocks.
This follows an earlier period in which AI-linked markets gained emerging-market capital at India’s expense.
The July movement does not prove that funds sold Korean semiconductor companies and directly bought TCS or Infosys. It is more accurately interpreted as a relative portfolio shift:
A sector can rally sharply without experiencing an equally sharp improvement in earnings.
When investors are heavily underweight, relatively modest positive news can produce:
That appears to be an important part of the Nifty IT rally.
FII ownership had declined across most index constituents before the rebound, while the index itself had fallen approximately 28% during 2026 before July.
The selective return of FPI buying during the first fortnight of July also created a more supportive environment for beaten-down large-cap sectors, although information technology received only a small net inflow during that fortnight.
The rally is therefore partly a reassessment of fundamentals and partly a correction of extreme positioning.
The distinction between a market rally and an operating recovery is important.
| Evidence of a rally | Evidence of a durable recovery |
|---|---|
| Share prices rise rapidly | Constant-currency revenue accelerates |
| Short positions unwind | Deal wins consistently convert into revenue |
| Valuation multiples expand | Earnings estimates move higher |
| Under-owned stocks attract buying | Client discretionary spending improves |
| Global portfolios rotate | Growth becomes broad across companies |
| Quarterly results beat low expectations | Guidance is upgraded over multiple quarters |
Through July 29, the evidence for a market rally was strong.
The evidence for a full operating recovery was still incomplete.
The rebound could become more durable if:
A weaker rupee can increase the rupee value of dollar revenue, but investors should distinguish currency translation from actual constant-currency business growth.
The main risks remain:
The sector could also correct if share prices rise faster than earnings expectations.
The next two quarters should be judged using operating indicators rather than price performance alone.
The most useful measures are:
A rising index answers the question of whether market sentiment has improved. These operating measures will answer whether the business cycle has improved.
The Nifty IT rally through July 29 is real in market terms.
Better-than-feared earnings, strong deal wins, measurable AI revenue and deeply underweight investor positioning have weakened the most bearish case against the sector. The correction in crowded Asian AI-hardware stocks provided an additional relative-allocation trigger.
But the operating evidence remains mixed.
TCS and Infosys delivered modest sequential growth. HCLTech’s bookings and AI revenue were strong, but total quarterly revenue declined sequentially. Tech Mahindra showed improving execution, while Wipro continued to face weak near-term growth.
The rally therefore appears to be a recovery from excessive pessimism, supported by an AI-led global rotation. It is not yet confirmation that Indian IT has entered a new high-growth cycle.
A durable comeback will require AI revenue to translate into broader growth, stronger guidance and sustained earnings upgrades without undermining pricing and margins.
Nifty IT had gained approximately 16% month to date through the close on July 29, 2026. This is not the final return for July because the month had not ended.
The index closed at 31,123.10, up 2.32% during the session.
The rally has been supported by better-than-feared quarterly results, growing AI revenue, strong deal wins, attractive valuations after the earlier correction, short covering and global rotation away from crowded AI-hardware stocks.
It is doing both. AI creates implementation, data, cloud and governance opportunities, but it can also reduce employee requirements, shorten project timelines and pressure traditional pricing.
Among the five large companies discussed, Tech Mahindra reported the strongest sequential constant-currency revenue growth at 2.6%.
Not yet. Revenue guidance remains modest, company performance is uneven and deal wins still need to convert into sustained revenue and earnings growth.
Indian IT had already corrected sharply and was under-owned, while AI-hardware stocks in markets such as South Korea had become crowded. This created conditions for relative portfolio rotation.
The main indicators are constant-currency revenue growth, guidance, deal conversion, AI revenue, margins, revenue per employee, headcount and foreign investor ownership.
Disclaimer: This article is for general information and educational purposes only. It does not constitute investment advice, a recommendation or an offer to buy or sell any security, index product or financial instrument. Market performance and company results may change after the stated data cut-off.
No spam. Only new posts, simple explainers, and practical money checklists for busy professionals.
Finnovate is a SEBI-registered financial planning firm that helps professionals bring structure and purpose to their money. Over 3,500+ families have trusted our disciplined process to plan their goals - safely, surely, and swiftly.
Our team constantly tracks market trends, policy changes, and investment opportunities like the ones featured in this Weekly Capsule - to help you make informed, confident financial decisions.
Learn more about our approach and how we work with you:
No comments yet. Start the conversation. What would you add?
No spam. Only new posts, simple explainers, and practical money checklists.
You may also like
Proposed EU scrap export curbs could affect India’s metal supply and manufacturing costs...

FPIs net sold $1.47 billion in Indian equities during September 1–15, 2026. Explore sect...

Nearly 39% of India’s monitored coal power plants were critically low on fuel in Septemb...

Tata Sons faces a major governance dispute over N Chandrasekaran’s reappointment, RBI li...
Popular now

Learn how to easily download your NSDL CAS Statement in PDF format with our step-by-step g...

Looking for the best financial freedom books? Here’s a handpicked 2026 reading list with...

Learn what SIF investment means in India, SEBI rules, Rs 10 lakh minimum investment, avail...

Clear guide to mutual fund taxation in India for FY 2025–26 after July 2024 changes: equ...