
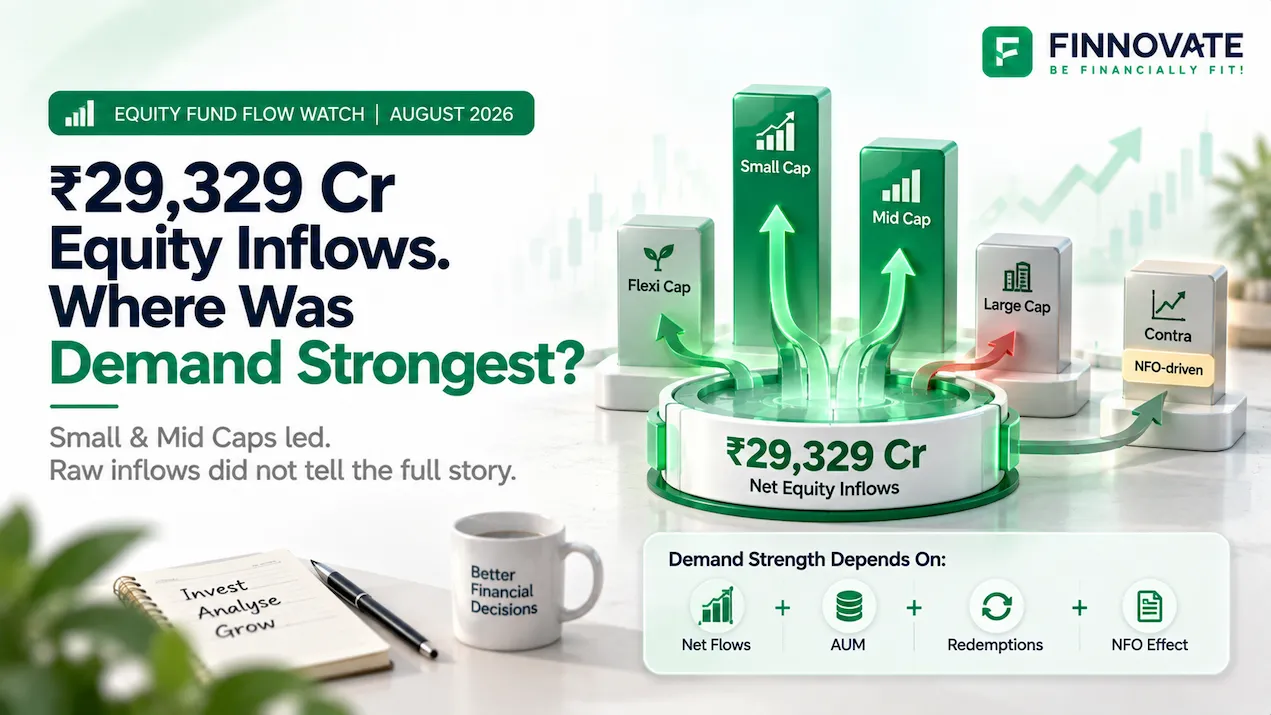
Equity Mutual Fund Inflows August 2026: Which Categories Led?
Equity mutual funds received ₹29,329 crore in August 2026. See which categories saw the ...
15 September 2026

Finnovate’s editorial team researches and creates financial content using trusted sources, regulatory references and inputs from subject experts.
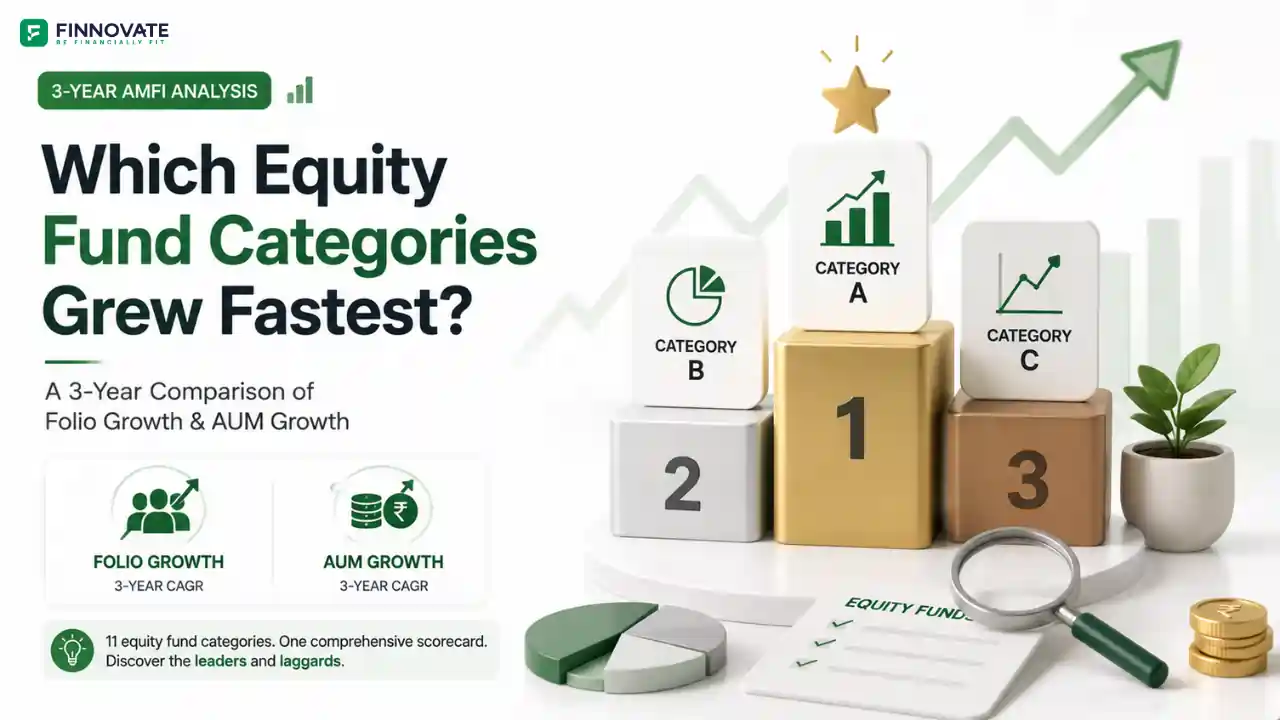
Equity mutual fund folios in India have grown at a CAGR of 22.96% over the last three years, while AUM has grown at 29.69%, according to AMFI data comparing May 2023 to May 2026. Both figures have roughly doubled in three years, even through a stretch marked by global geopolitical turmoil.
But the aggregate number hides a wide spread. Across the 11 equity fund categories tracked by AMFI, folio growth ranges from under 2% to over 40%, and the categories leading on investor count are not always the same ones leading on money.
This article ranks all 11 equity fund categories on a combined measure of folio growth and AUM growth, and looks at what the spread says about where retail money is actually going.
| Equity Scheme | Folios May-26 | Folios May-23 | CAGR Folios | AUM May-26 (Rs Cr) | AUM May-23 (Rs Cr) | CAGR AUM | Avg Rank |
|---|---|---|---|---|---|---|---|
| Multi Cap Fund | 1,16,41,382 | 42,12,703 | 40.33% | 2,32,886.94 | 74,016.91 | 46.53% | 1.00 |
| Sectoral/Thematic Funds | 3,23,92,112 | 1,32,09,299 | 34.85% | 5,35,187.18 | 1,86,684.60 | 42.06% | 2.50 |
| Small Cap Fund | 2,84,49,224 | 1,15,81,947 | 34.93% | 4,04,379.58 | 1,53,806.54 | 38.02% | 2.50 |
| Mid Cap Fund | 2,52,57,209 | 1,08,20,927 | 32.65% | 4,87,793.68 | 2,04,479.88 | 33.62% | 4.50 |
| Large & Mid Cap Fund | 1,39,42,522 | 79,10,456 | 20.79% | 3,39,999.87 | 1,40,558.18 | 34.24% | 5.50 |
| Value / Contra Fund | 90,13,652 | 47,93,275 | 23.43% | 2,10,504.18 | 97,844.37 | 29.09% | 6.00 |
| Flexi Cap Fund | 2,39,64,185 | 1,27,31,864 | 23.47% | 5,63,895.97 | 2,62,586.89 | 29.02% | 6.00 |
| Dividend Yield Fund | 11,96,628 | 7,41,636 | 17.29% | 31,305.62 | 15,209.50 | 27.20% | 8.00 |
| Large Cap Fund | 1,71,79,356 | 1,29,34,624 | 9.92% | 3,97,060.82 | 2,51,231.75 | 16.48% | 9.50 |
| Focused Fund | 55,43,597 | 52,58,096 | 1.78% | 1,74,258.49 | 1,06,413.05 | 17.87% | 10.00 |
| ELSS | 1,63,35,643 | 1,52,82,099 | 2.25% | 2,36,446.07 | 1,63,766.51 | 13.02% | 10.50 |
| Total of Equity Funds | 18,49,15,510 | 9,94,76,926 | 22.96% | 36,13,718.41 | 16,56,598.17 | 29.69% |
The four categories in the top bracket combine strong folio growth with strong AUM growth: Multi Cap, Sectoral/Thematic, Small Cap, and Mid Cap Fund. Three of these are what could be called alpha-seeking categories, while Multi Cap Fund is allocation-linked by mandate, requiring a minimum spread across large, mid, and small cap stocks.
Folio CAGR of 40.33% and AUM CAGR of 46.53%, the fastest of any category on both counts. Multi Cap Fund also started from a comparatively low base in 2023, which amplifies its CAGR relative to older, larger categories.
Both categories grew folios at roughly 35% CAGR, with AUM CAGR of 42.06% for Sectoral/Thematic and 38.02% for Small Cap. Both sit in AMFI's higher-risk category classifications, and their growth suggests continuing retail appetite for higher-risk, higher-potential-return categories even through a volatile three-year stretch.
Folio CAGR of 32.65% and AUM CAGR of 33.62%, rounding out the top bracket. Mid Cap Fund's growth has been more evenly matched between folios and AUM than the other three categories in this group.
A second set of four categories sits in the middle: Large & Mid Cap Fund, Value/Contra Fund, Flexi Cap Fund, and Dividend Yield Fund. These categories are typically built around a specific investing style or mandate constraint rather than a single market-cap or sector bet, which may explain more measured folio growth even where AUM growth has kept pace.
Flexi Cap Fund is a useful example of this pattern. Its folio CAGR of 23.47% is middling relative to the top bracket, but it is the single largest category by AUM in 2026, at Rs 5,63,895.97 crore. That combination, moderate folio growth but the largest asset base, suggests Flexi Cap Fund draws large individual allocations rather than a proportionally larger number of new investors.
Dividend Yield Fund sits at the bottom of this middle group, with the slowest folio CAGR (17.29%) of the four, though its AUM CAGR of 27.20% is still stronger than every category in the bottom bracket.
Three categories show single-digit or near-single-digit folio growth over the three years: Large Cap Fund, Focused Fund, and ELSS.
Large Cap Fund's folio CAGR of 9.92% is the weakest among the three, and it has slipped in the AUM rankings too, falling from the second-largest equity category by AUM in 2023 to fifth-largest in 2026. Focused Fund's folio CAGR of just 1.78% is the lowest of all 11 categories, though its AUM CAGR of 17.87% is still meaningfully positive, again pointing to concentration of AUM among fewer, larger investors rather than a widening retail base.
ELSS folio CAGR sits at 2.25%, the second-lowest in the data set. ELSS's tax-saving appeal under Section 80C is only available to taxpayers who opt for the old tax regime, and the growing shift toward the new tax regime over the last few years may be a contributing factor to its comparatively slower folio growth, alongside the category's mandatory three-year lock-in relative to the fully liquid categories in this data set.
The spread in this data points to a broader pattern: retail investors have shown a stronger preference for alpha-seeking, less-constrained categories over the last three years than for large-cap or lock-in-linked categories, even in a volatile market environment. Sectoral and thematic fund allocation in particular has continued to draw sustained folio growth, not just a one-time spike.
At the same time, AUM growth has outpaced folio growth in nearly every category, which historically has meant that existing investors are adding more per account rather than the investor base multiplying at the same rate as the money. Whether that combination represents a healthy maturing of allocations or a concentration risk worth monitoring may be worth reviewing in the context of an individual's own portfolio construction and diversification across market-cap segments.
Multi Cap Fund, with a folio CAGR of 40.33% and an AUM CAGR of 46.53%, the highest of all 11 equity categories tracked by AMFI between May 2023 and May 2026.
ELSS's Section 80C tax benefit is only available under the old tax regime, and its mandatory three-year lock-in is longer than most other equity categories, both of which may be contributing to its comparatively slow 2.25% folio CAGR.
Yes. Flexi Cap Fund is the largest equity category by AUM in 2026, at over Rs 5.6 lakh crore, even though its folio CAGR of 23.47% is middling relative to the fastest-growing categories.
Large Cap Fund has gone from the second-largest equity category by AUM in 2023 to the fifth-largest in 2026, alongside the slowest folio CAGR among the three worst-performing categories, indicating a broader retail shift toward other equity categories over this period.
It can signal that existing investors are increasing their allocation sizes rather than the investor base growing at the same pace. Please consult a SEBI-registered investment adviser to review how this pattern may apply to your own portfolio construction.
Disclaimer: This article is for general information and educational purposes only. It does not constitute investment advice, a recommendation, or an offer to buy or sell any securities or financial instruments. Folio and AUM data referenced in this article are sourced from AMFI and are based on publicly available figures as of the date of writing, subject to revision. Past AUM and folio growth patterns are not indicative of future outcomes. Please consult a SEBI-registered investment adviser or qualified financial professional before making any investment decision. Mutual fund investments are subject to market risks.
No spam. Only new posts, simple explainers, and practical money checklists for busy professionals.
Finnovate is a SEBI-registered financial planning firm that helps professionals bring structure and purpose to their money. Over 3,500+ families have trusted our disciplined process to plan their goals - safely, surely, and swiftly.
Our team constantly tracks market trends, policy changes, and investment opportunities like the ones featured in this Weekly Capsule - to help you make informed, confident financial decisions.
Learn more about our approach and how we work with you:
No comments yet. Start the conversation. What would you add?
No spam. Only new posts, simple explainers, and practical money checklists.
You may also like
Equity mutual funds received ₹29,329 crore in August 2026. See which categories saw the ...

When should you exit a mutual fund? Learn when to hold, stop a SIP, rebalance or redeem ba...

Mutual fund AUM rose ₹3.54 lakh crore in July 2026. See how much came from fresh inflows...
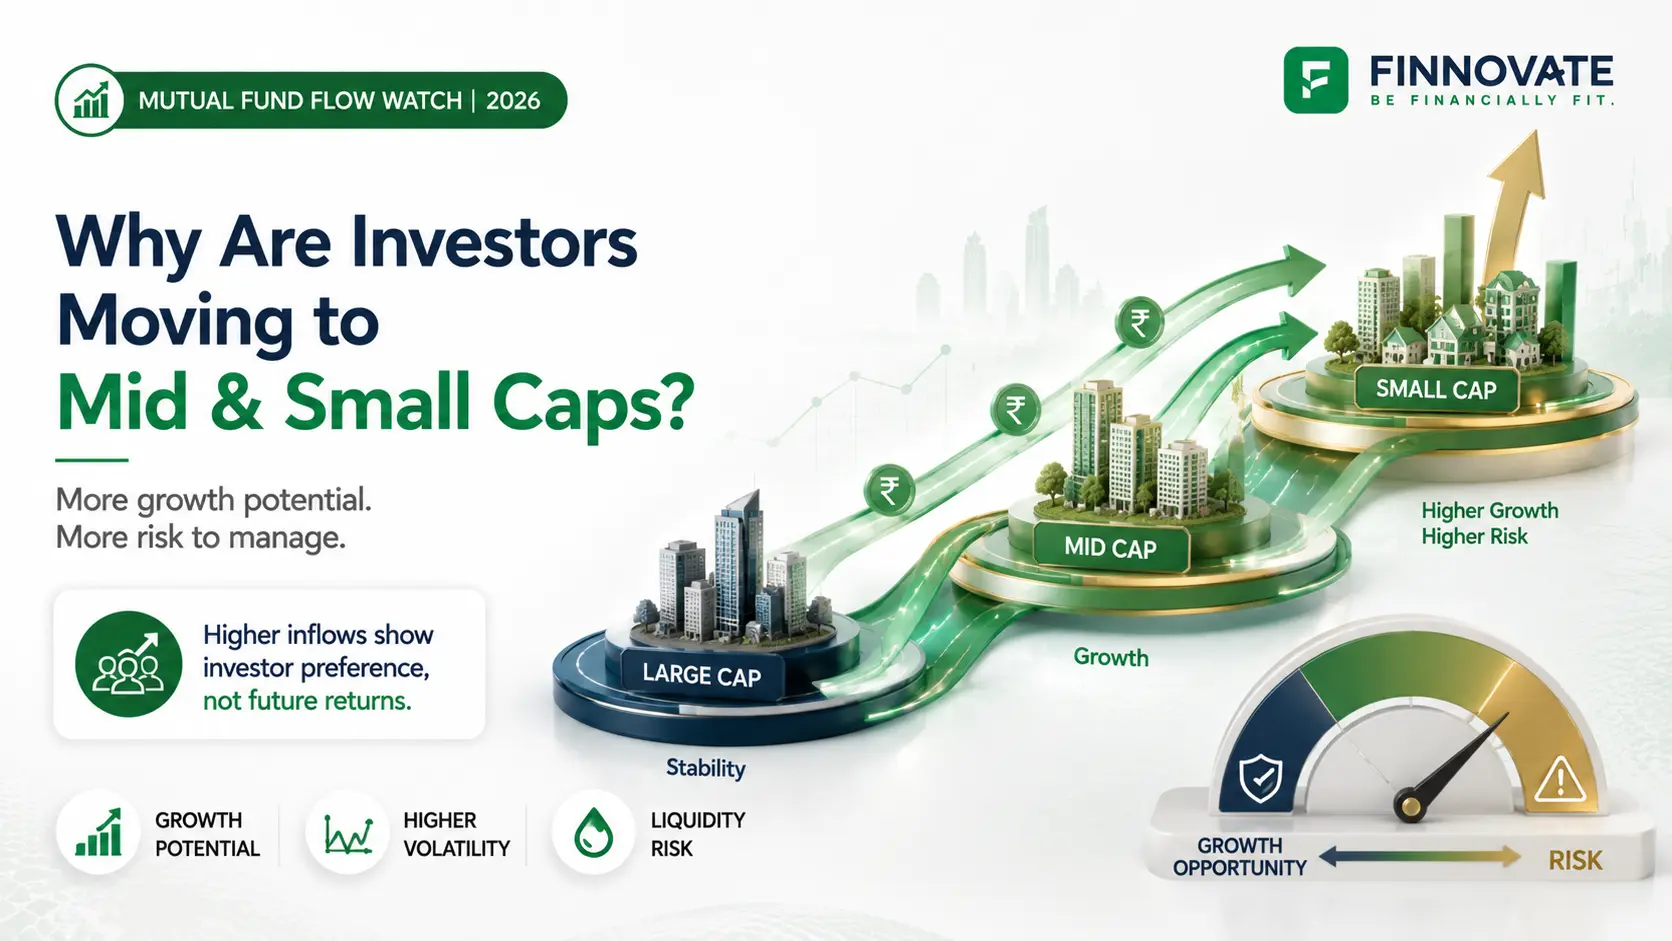
Small- and mid-cap funds drew nearly 7x more inflows than large-cap funds from February to...
Popular now

Learn how to easily download your NSDL CAS Statement in PDF format with our step-by-step g...

Looking for the best financial freedom books? Here’s a handpicked 2026 reading list with...

Learn what SIF investment means in India, SEBI rules, Rs 10 lakh minimum investment, avail...

Clear guide to mutual fund taxation in India for FY 2025–26 after July 2024 changes: equ...