
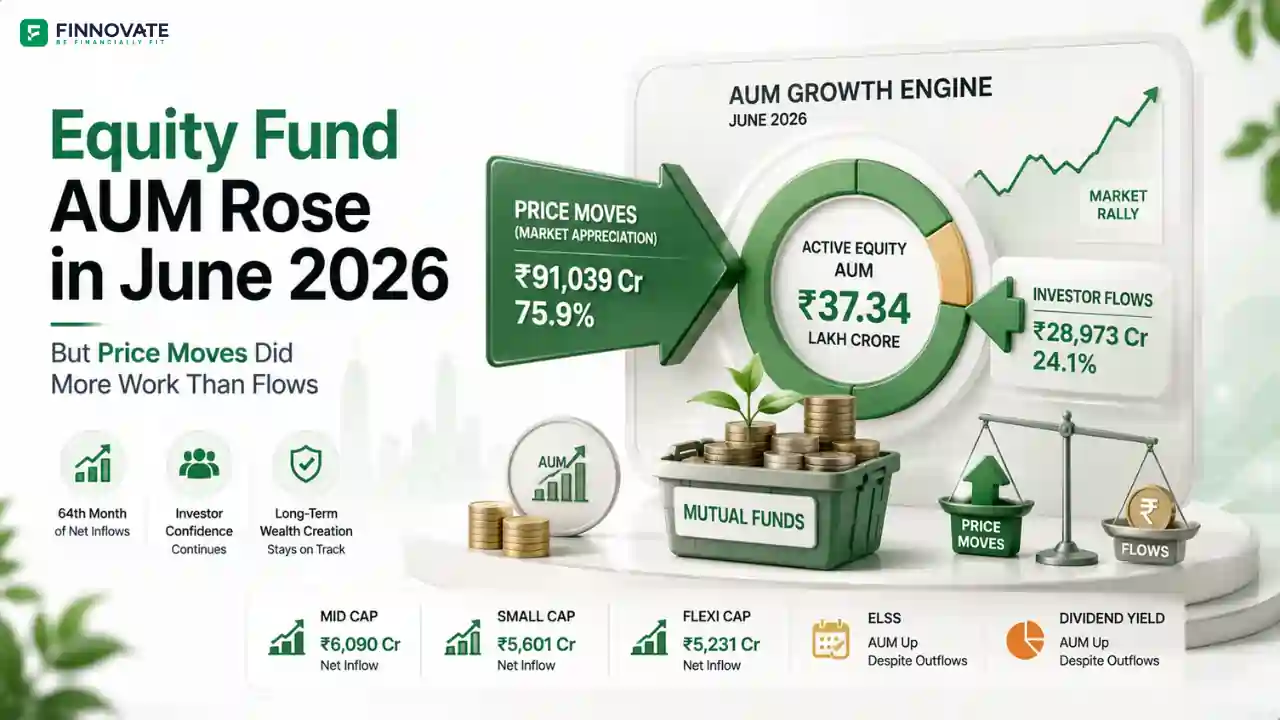
Equity Fund AUM June 2026: Price Moves Did More Work Than Flows
Active equity fund AUM rose 3.3% to ₹37.34 lakh crore in June 2026. Price accretion of �...
15 July 2026

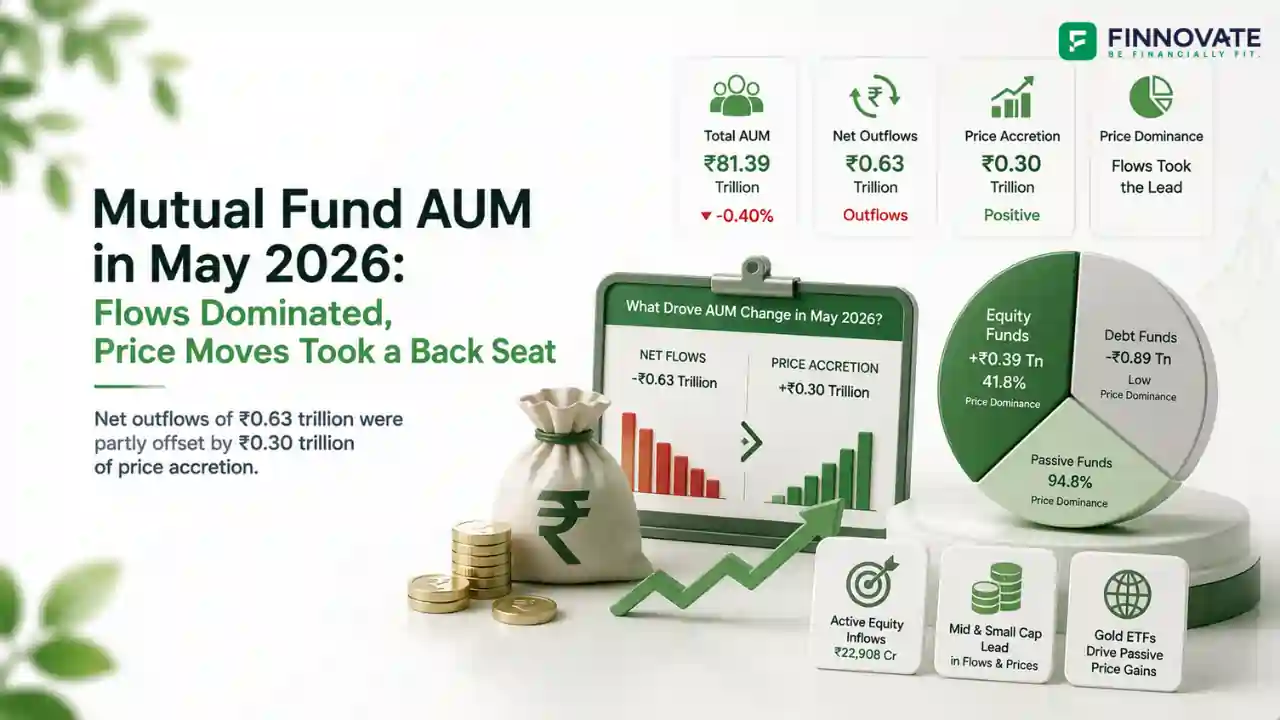
Passive funds in India closed May 2026 with a paradox. Folios grew 33.3% year-on-year. AUM grew 24.7%. Yet net inflows for the entire month came to just ₹362 crore, the thinnest reading in recent memory. Six of the twelve passive fund categories saw net outflows. The headline growth numbers are real, but the flow story tells a different tale.
The divergence is explained by three forces pulling simultaneously: precious metals profit-booking after a strong 2025 rally, rising bond yield anxiety driving debt ETF exits, and base-effect fatigue moderating equity index ETF momentum. At the same time, a quieter but significant shift is underway: overseas fund-of-funds (FoFs) are attracting growing interest as a diversification tool.
This article breaks down the May 2026 passive fund data by category, examines the folio and AUM growth story in detail, and identifies the three structural trends reshaping the passive investing landscape in India.
Total passive fund AUM stood at ₹15,26,511 crore as of May 31, 2026, a 24.7% increase year-on-year. Total folios reached 5.66 crore, up 33.3% from the same period last year. Net inflows for the month, however, were just ₹362 crore, with equity index ETF gains almost entirely offset by outflows from debt ETFs, gold ETFs, and silver ETFs.
| Passive Fund Category | May-26 Folios | YoY (%) | May-26 AUM (₹ Cr) | YoY (%) | Net Flows (₹ Cr) |
|---|---|---|---|---|---|
| Equity Index Funds (Domestic) | 1,47,56,357 | 16.17% | 2,25,251.07 | 23.73% | 2,782.42 |
| Equity Index Funds (International) | 2,91,491 | 22.76% | 8,210.29 | 55.72% | 13.64 |
| Debt Index Funds (TMIF) | 1,70,378 | -8.52% | 88,348.36 | -14.87% | -993.75 |
| Debt Index Funds (Ex-TMIF) | 34,906 | 270.91% | 6,712.57 | 11.45% | -864.54 |
| Other Index Funds | 1,16,797 | 17.74% | 3,872.43 | 4.85% | 5.50 |
| Gold ETF | 1,23,40,801 | 67.47% | 1,84,570.85 | 195.54% | -725.04 |
| Equity Oriented ETFs (Domestic) | 1,90,09,356 | 16.88% | 7,59,937.51 | 7.77% | 6,691.57 |
| Equity Oriented ETFs (International) | 11,94,052 | 28.88% | 21,212.35 | 51.77% | 0.00 |
| Debt Oriented ETFs | 16,66,021 | -32.42% | 92,748.27 | -5.35% | -5,178.63 |
| Silver ETF | 51,54,393 | 515.30% | 86,216.86 | 411.18% | -2,133.15 |
| FOFs on Overseas Active Funds | 13,64,332 | 75.87% | 38,630.22 | 104.22% | 816.27 |
| FOFs on Overseas Passive Funds | 5,27,190 | -12.35% | 10,799.96 | 33.36% | -52.30 |
| Total Passive Funds | 5,66,26,074 | 33.32% | 15,26,510.75 | 24.69% | 361.98 |
Total net inflows into passive funds in May 2026 were just ₹362 crore: the result of ₹6,692 crore in equity index ETF inflows being nearly wiped out by ₹5,179 crore in debt-oriented ETF outflows, ₹2,133 crore in silver ETF outflows, and ₹725 crore in gold ETF outflows. The three outflow categories together absorbed almost all of the equity category's gains.
Debt-oriented ETF outflows were the single largest drag on passive flows in May. India's 10-year G-sec yield climbed approximately 34 basis points to around 7% in the months preceding May 2026, driven by inflation concerns following the Iran conflict and market pricing of a potential RBI rate hike. ICRA noted that G-sec yields moved up 28 basis points during May 2026 alone, the effective equivalent of a rate hike, even though the RBI held its repo rate at 5.25%. When yields rise, existing bond prices fall, and longer-duration debt ETFs lose value. Institutional and long-duration investors responded by exiting. Over the year to May, debt-oriented ETF folios contracted 32.4% and AUM fell 5.4%.
Gold ETFs recorded net outflows of ₹725 crore in May 2026, ending a 13-month inflow streak. The reversal reflects profit-booking after gold's sharp rally in 2025, a global moderation in precious metals ETF demand. The World Gold Council noted that only Europe recorded gold ETF inflows in May 2026. New investment restrictions placed by major fund houses including HDFC Mutual Fund, Nippon India Mutual Fund, and Tata Mutual Fund on large gold ETF subscriptions. Despite the monthly outflow, gold ETFs have attracted substantial inflows over the year, and their AUM still grew 195.5% YoY to ₹1,84,571 crore.
Silver ETFs saw net outflows of ₹2,133 crore in May even as their YoY folio count grew 515% and AUM expanded 411%. This apparent contradiction reflects timing: the folio surge happened during 2025's strong silver price performance, and May 2026 outflows represent profit-booking by investors who entered at lower levels. The combined AUM of gold and silver ETFs now stands at over ₹2.71 lakh crore, approximately 3.5 times where it was a year ago, reflecting the lasting structural shift in precious metals participation even as short-term flows cool.
The 33.3% folio growth and 24.7% AUM growth for passive funds YoY are still meaningful, but the rate of expansion is decelerating. The exceptional base built during 2025's precious metals-driven inflow surge is now making year-on-year comparisons progressively harder, and broader market uncertainties have dampened incremental flows across categories.
Three categories dominated folio expansion over the year to May 2026. Silver ETFs led at 515% folio growth, driven by the strong price performance of silver in 2025 and favourable tax changes that reduced the LTCG holding period to one year with a 12.5% cap. Debt Index Funds (Ex-TMIF) grew folios 271%, though from a small base. Gold ETFs grew folios 67.5%, reflecting the sustained investor interest built during the 2025 bullion rally.
Two categories saw folio contraction. Debt-oriented ETFs lost 32.4% of their folio base YoY. FOFs on overseas passive funds contracted 12.4%. Both declines reflect investors reassessing risk-return in a rising yield environment and the differential performance across overseas fund types. For more on how taxation affects these choices, see Finnovate's explainer on mutual fund taxation for FY 2025-26.
AUM growth mirrors folio trends but with amplification from price movements. The table below shows the spread across categories:
| Category | AUM YoY (%) | Direction |
|---|---|---|
| Silver ETF | +411.18% | Strong growth, driven by 2025 price rally and tax changes |
| Gold ETF | +195.54% | Strong growth. Bullion rally:; combined gold+silver AUM now over ₹2.71 lakh crore |
| FOFs on Overseas Active Funds | +104.22% | AUM doubled. Rising interest in global diversification |
| Equity Index Funds (International) | +55.72% | Moderate growth. Overseas equity market performance |
| Equity Oriented ETFs (Domestic) | +7.77% | Modest growth. Largest category by AUM at ₹7.60 lakh crore |
| Debt Oriented ETFs | -5.35% | Contraction. Bond yield pressure; folio base fell 32.4% |
| Debt Index Funds (TMIF) | -14.87% | Steepest AUM decline. Interest rate cycle impact |
The overall pace of folio and AUM growth in passive funds has been tapering for several months. Persistent FPI selling, MSCI weight adjustments, and macro volatility have dampened incremental participation. The 33% folio growth number still looks strong, but the trajectory from here is more likely to moderate than accelerate.
Three distinct structural patterns have emerged from May 2026 passive data, each pointing in a different direction for the category over the next 12 to 18 months.
The contraction in debt-oriented ETFs is not a single-month event. It reflects a sustained rotation away from long-duration passive debt instruments as bond yields have risen sharply over the past year.
Investors who held these instruments for stability are reassessing their allocation to passive debt, particularly in the index ETF format.
Both gold and silver ETFs saw net outflows in May despite their extraordinary long-run folio and AUM numbers. Four factors explain the moderation:
For a full breakdown on how gold is taxed in India, see Finnovate's guide on taxation of gold in India.
FOFs on overseas active funds recorded ₹816 crore in net inflows in May 2026, 75.9% folio growth YoY, and AUM that more than doubled to ₹38,630 crore. Three factors are driving this shift:
Investors considering the broader active-versus-passive question may find Finnovate's analysis on active vs passive portfolio management a useful reference.
A SEBI-registered investment adviser can help assess whether your existing passive fund mix aligns with your income needs, risk profile, and tax position in the current market environment.
Book a Discovery CallPassive fund net inflows fell to just ₹362 crore in May 2026 because outflows from debt-oriented ETFs (₹5,179 crore), silver ETFs (₹2,133 crore), and gold ETFs (₹725 crore) nearly offset the ₹6,692 crore in equity index ETF inflows. Rising bond yields drove debt ETF exits, while precious metals profit-booking reduced gold and silver ETF inflows.
Gold ETFs ended a 13-month streak of consecutive inflows in May 2026, recording ₹725 crore in net outflows. The outflow reflects investor profit-booking after the strong bullion rally in 2025, new investment restrictions placed by several fund houses on large gold ETF subscriptions, and a broader global moderation in precious metals ETF flows during the month.
Six categories recorded net outflows in May 2026: debt-oriented ETFs (₹5,179 crore), silver ETFs (₹2,133 crore), gold ETFs (₹725 crore), debt index funds, TMIF category (₹994 crore), debt index funds ex-TMIF (₹865 crore), and FOFs on overseas passive funds (₹52 crore). Data Source: AMFI.
Debt-oriented ETFs are facing outflows because India's bond yields have risen sharply. The 10-year G-sec yield moved from approximately 6.27% a year ago to around 7% by May 2026. Rising yields cause existing bond prices to fall, reducing the value of debt ETF portfolios and prompting investors to exit long-duration instruments. ICRA noted that G-sec yields moved up 28 basis points in May 2026 alone, the effective equivalent of a rate hike. Please consult a SEBI-registered investment adviser before making any changes to your debt fund allocation.
Total passive fund AUM in India stood at ₹15,26,511 crore (approximately ₹15.27 lakh crore) as of May 31, 2026, a 24.7% increase year-on-year. Equity-oriented ETFs (domestic) were the largest category at ₹7,59,938 crore, followed by debt-oriented ETFs at ₹92,748 crore and gold ETFs at ₹1,84,571 crore. Data Source: AMFI.
Silver ETF outflows of ₹2,133 crore in May 2026 reflect profit-booking after the strong 2025 rally rather than a confirmed trend reversal. Silver ETF folios still grew 515% YoY and AUM expanded 411% YoY, indicating that the investor base built over the past year remains largely intact. Whether outflows continue will depend on silver prices, global commodity sentiment, and investor behaviour in subsequent months.
Disclaimer: This article is for general information and educational purposes only. It does not constitute investment advice, a recommendation, or an offer to buy or sell any securities or financial instruments. Passive fund flow data, folio counts, and AUM figures are sourced from AMFI and are subject to revision. Past performance and historical flow patterns in passive funds, ETFs, gold, silver, and debt instruments are not indicative of future outcomes. Investors should not make any investment decision based solely on this article. Please consult a SEBI-registered investment adviser or qualified financial professional before making any investment decision. Mutual fund investments are subject to market risks. Please read all scheme-related documents carefully before investing.
No spam. Only new posts, simple explainers, and practical money checklists for busy professionals.
Finnovate is a SEBI-registered financial planning firm that helps professionals bring structure and purpose to their money. Over 3,500+ families have trusted our disciplined process to plan their goals - safely, surely, and swiftly.
Our team constantly tracks market trends, policy changes, and investment opportunities like the ones featured in this Weekly Capsule - to help you make informed, confident financial decisions.
Learn more about our approach and how we work with you:
No comments yet. Start the conversation. What would you add?
No spam. Only new posts, simple explainers, and practical money checklists.
You may also like
Active equity fund AUM rose 3.3% to ₹37.34 lakh crore in June 2026. Price accretion of �...
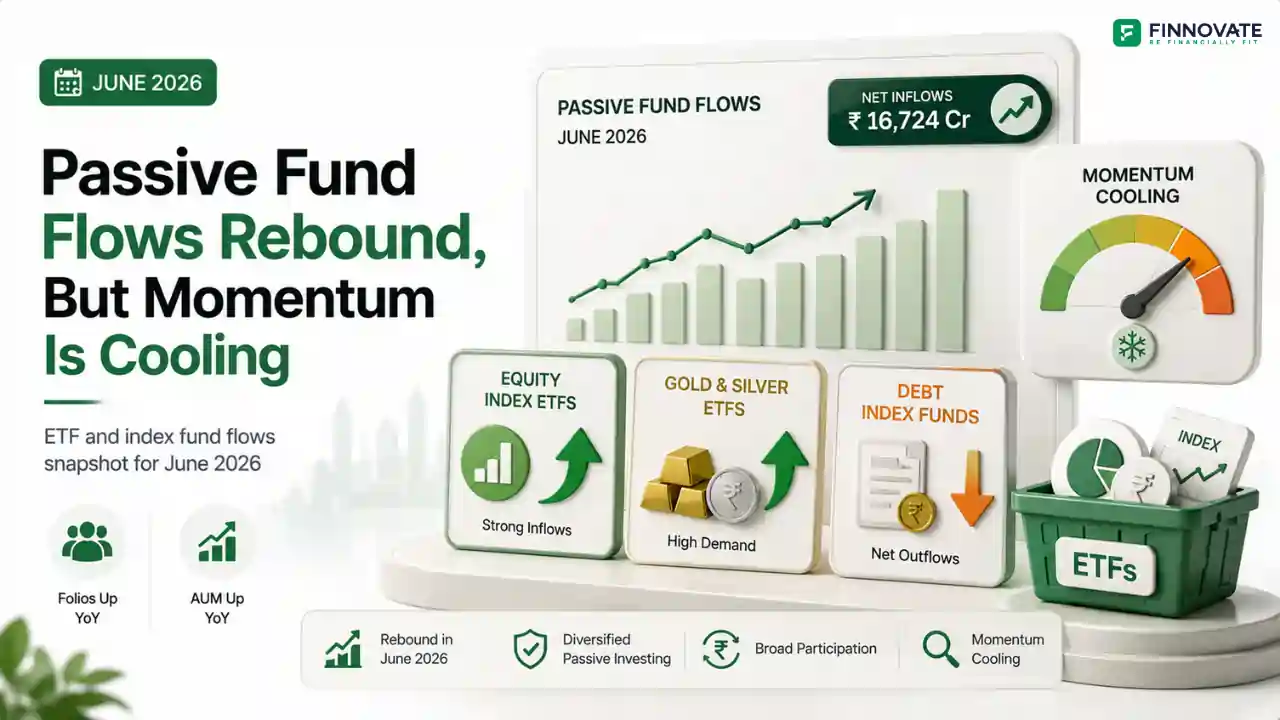
Passive fund inflows rebounded to ₹16,724 crore in June 2026, with gold and silver ETFs ...

Equity fund folios grew 22.96% CAGR and AUM 29.69% over 3 years. See which of the 11 categ...
Active equity MF inflows fell 40.4% in May 2026 to ₹22,908 crore, but still drove more A...
Popular now

Learn how to easily download your NSDL CAS Statement in PDF format with our step-by-step g...

Learn what SIF investment means in India, SEBI rules, Rs 10 lakh minimum investment, avail...

Looking for the best financial freedom books? Here’s a handpicked 2026 reading list with...

Clear guide to mutual fund taxation in India for FY 2025–26 after July 2024 changes: equ...