

Equity Mutual Fund Inflows August 2026: Which Categories Led?
Equity mutual funds received ₹29,329 crore in August 2026. See which categories saw the ...
15 September 2026

Finnovate’s editorial team researches and creates financial content using trusted sources, regulatory references and inputs from subject experts.
Data period: June 2026 | Source: AMFI monthly data
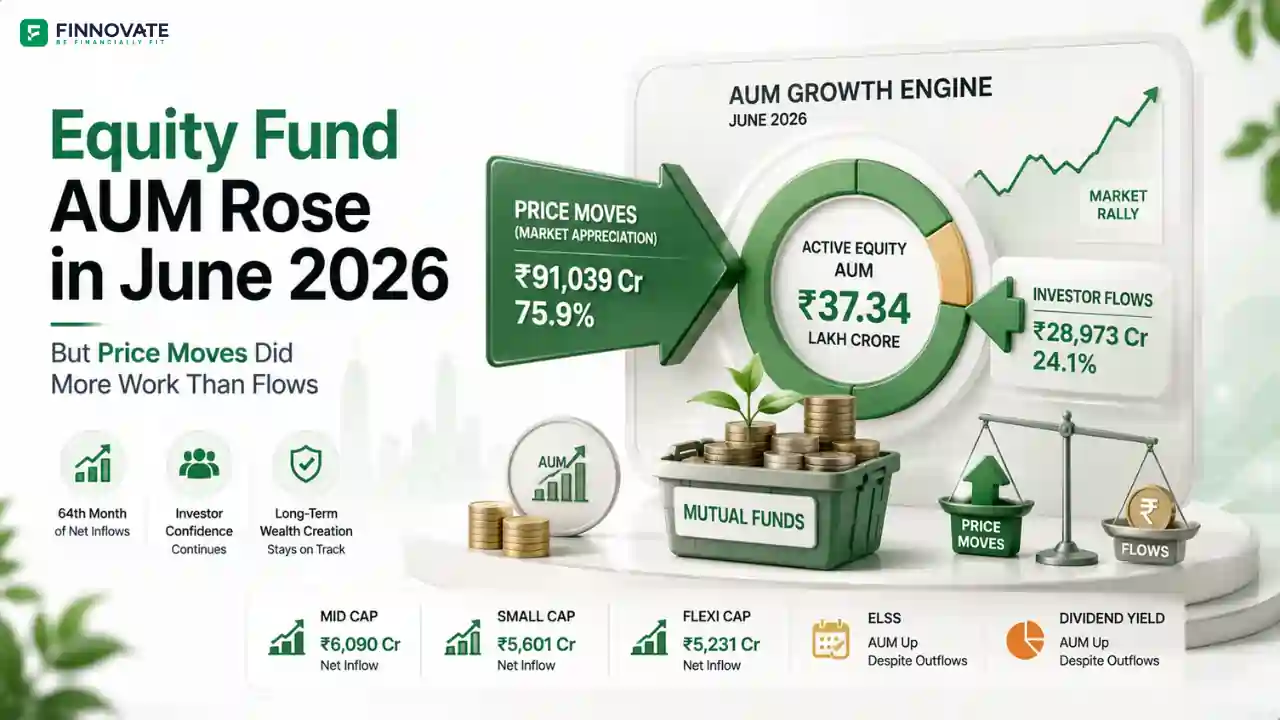
Active equity mutual funds recorded net inflows of ₹28,973 crore in June 2026, up 26.5% from May and the 64th consecutive month of net equity inflows. But the more significant story in the June AUM data is not flows. The total AUM of open-ended mutual funds rose by ₹0.67 lakh crore in June, comprising ₹1.17 lakh crore of price accretion and ₹0.50 lakh crore of net outflows from the industry as a whole. For active equity funds specifically, price accretion of ₹91,039 crore drove 75.9% of the ₹1,20,013 crore AUM increase. A Middle East peace optimism rally lifted equity markets through the month, doing more for AUM than investor flows.
June 2026 equity fund AUM: what moved the needle
Price dominance measures what percentage of a fund category's total AUM change was driven by market price movements rather than net investor flows. Price accretion is the increase in a fund's AUM from the rise in NAV of existing holdings; it requires no new investor money and happens automatically when markets rise.
A price dominance above 100% means the category's AUM grew entirely because of market appreciation, even though investors were net withdrawing money. A low price dominance (below 70%) means investor flows were the primary driver of AUM change, signalling stronger investor conviction in that category.
| Fund Category | Net Flows (₹ Cr) | AUM Closing (₹ Cr) | Total AUM Shift (₹ Cr) | Price Shift (₹ Cr) | Price Dominance |
|---|---|---|---|---|---|
| Dividend Yield Fund | -49 | 31,711 | 405 | 455 | 112.2% |
| ELSS | -634 | 2,41,896 | 5,450 | 6,084 | 111.6% |
| Sectoral / Thematic Funds | +1,469 | 5,46,908 | 11,721 | 10,252 | 87.5% |
| Large Cap Fund | +2,067 | 4,08,454 | 11,393 | 9,325 | 81.9% |
| Value / Contra Fund | +687 | 2,14,073 | 3,569 | 2,882 | 80.8% |
| Focused Fund | +1,118 | 1,79,518 | 5,259 | 4,141 | 78.7% |
| Small Cap Fund | +5,602 | 4,29,715 | 25,335 | 19,733 | 77.9% |
| Flexi Cap Fund | +5,231 | 5,80,639 | 16,743 | 11,512 | 68.8% |
| Large & Mid Cap Fund | +4,321 | 3,53,143 | 13,143 | 8,822 | 67.1% |
| Mid Cap Fund | +6,090 | 5,06,070 | 18,276 | 12,186 | 66.7% |
| Multi Cap Fund | +3,070 | 2,41,604 | 8,717 | 5,647 | 64.8% |
| Total Active Equity Funds | +28,973 | 37,33,731 | 1,20,013 | 91,039 | 75.9% |
Price accretion of ₹91,039 crore drove 75.9% of active equity AUM growth, high by historical standards. In months where flows are the primary driver, price dominance typically sits in the 40% to 60% range. June's elevated reading reflects the equity market rally on Middle East peace optimism, which lifted NAVs across all equity fund categories simultaneously.
The macro picture reinforces this. At the total open-ended fund industry level, price accretion of ₹1.17 lakh crore more than offset the ₹0.50 lakh crore net outflow from the industry, resulting in an overall AUM increase despite negative industry-wide net flows.
The five categories with the lowest price dominance (Multi-cap (64.8%), Mid-cap (66.7%), Large & Mid-cap (67.1%), Flexi-cap (68.8%), and Small-cap (77.9%)) were also the five with the highest net inflows. Together they drew 84.4% of total active equity flows in June and accounted for 68.5% of the total AUM shift for the month.
When investor flows are robust, the flow component of AUM growth is large, which mathematically reduces price dominance as a percentage even when absolute price accretion is also high. The flow pattern reflects two dominant investor themes in June: alpha-seeking across mid, small, and multi-cap categories, and market-cap diversification through flexi-cap and large & mid-cap funds.
Dividend Yield Funds (112.2%) and ELSS (111.6%) saw price dominance above 100% in June. Both had net outflows, yet AUM ended the month higher entirely because market prices rose. The AUM headline in these categories looks positive, but the underlying flow data reflects negative investor sentiment.
ELSS net outflow in June reflects the post-March tax-season redemption cycle. Most ELSS investments are made in January to March to claim Section 80C deductions in the same financial year. After the three-year lock-in expires, a portion of those investors redeem, creating seasonal outflow pressure in the following months. The underlying conviction-led ELSS buying happens earlier in the year, not in June.
Total open-ended MF AUM at June 30, 2026, up 0.82% from ₹81.58 lakh crore in May
Price accretion across all open-ended funds in June, from equity and debt price moves combined
Net outflows from all open-ended funds in June, almost entirely from debt fund redemptions
June's flow data shows most conviction-led money going into mid-cap, small-cap, and flexi-cap categories. Whether that mix is right depends on your time horizon and risk profile. The FinnFit Financial Fitness Test takes 3 minutes and gives you a clearer picture of your portfolio's fit.
Take the FinnFit TestPrice dominance measures what percentage of a fund category's total AUM change was driven by market price movements rather than net investor flows. A reading above 100% means AUM grew despite net outflows, entirely due to market appreciation. A reading below 70% signals that investor flows were the primary driver of AUM change in that month.
Both categories saw net outflows in June, but equity markets rose sharply enough that NAV appreciation on remaining holdings more than offset the capital withdrawn. ELSS outflows in particular reflect the post-March tax-season redemption cycle, as investors whose three-year lock-in expired redeem after the financial year-end. Past performance is not indicative of future returns.
Mid-cap funds led with ₹6,090 crore, followed by Small-cap (₹5,601 crore), Flexi-cap (₹5,231 crore), Large & Mid-cap (₹4,321 crore), and Multi-cap (₹3,070 crore). These five categories together drew 84.4% of all active equity net inflows in June. Please consult a SEBI-registered investment adviser before making any fund allocation decisions.
Large-cap stocks are more efficiently priced and widely tracked, which historically reduces the scope for active managers to consistently outperform their benchmarks. Investors appear to be increasingly using passive index funds and ETFs for large-cap exposure, where lower costs are a structural advantage, while directing active fund flows toward mid-cap and small-cap categories where active management has historically had more room to add value above benchmark.
Disclaimer: This article is for general information and educational purposes only. It does not constitute investment advice, a recommendation, or an offer to buy or sell any securities or financial instruments. All mutual fund AUM and flow data is sourced from AMFI monthly reports for June 2026. AUM figures are as of June 30, 2026. Price dominance calculations are Finnovate's own analysis applied to AMFI data. Past performance and flow trends are not indicative of future returns or flows. Mutual fund investments are subject to market risks; please read all scheme-related documents carefully before investing. Please consult a SEBI-registered investment adviser before making any investment decision.
No spam. Only new posts, simple explainers, and practical money checklists for busy professionals.
Finnovate is a SEBI-registered financial planning firm that helps professionals bring structure and purpose to their money. Over 3,500+ families have trusted our disciplined process to plan their goals - safely, surely, and swiftly.
Our team constantly tracks market trends, policy changes, and investment opportunities like the ones featured in this Weekly Capsule - to help you make informed, confident financial decisions.
Learn more about our approach and how we work with you:
No comments yet. Start the conversation. What would you add?
No spam. Only new posts, simple explainers, and practical money checklists.
You may also like
Equity mutual funds received ₹29,329 crore in August 2026. See which categories saw the ...

When should you exit a mutual fund? Learn when to hold, stop a SIP, rebalance or redeem ba...

Mutual fund AUM rose ₹3.54 lakh crore in July 2026. See how much came from fresh inflows...

Small- and mid-cap funds drew nearly 7x more inflows than large-cap funds from February to...
Popular now

Learn how to easily download your NSDL CAS Statement in PDF format with our step-by-step g...

Looking for the best financial freedom books? Here’s a handpicked 2026 reading list with...

Learn what SIF investment means in India, SEBI rules, Rs 10 lakh minimum investment, avail...

Clear guide to mutual fund taxation in India for FY 2025–26 after July 2024 changes: equ...