

Equity Mutual Fund Inflows August 2026: Which Categories Led?
Equity mutual funds received ₹29,329 crore in August 2026. See which categories saw the ...
15 September 2026

Finnovate’s editorial team researches and creates financial content using trusted sources, regulatory references and inputs from subject experts.
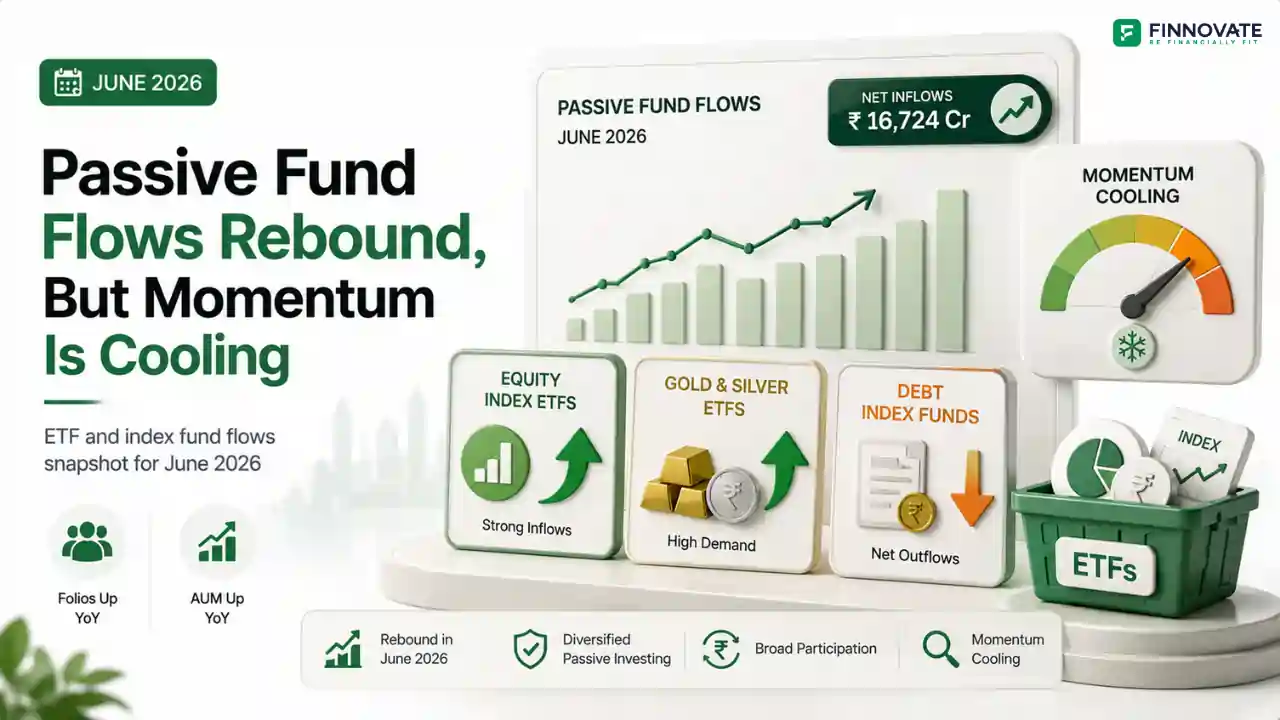
Passive fund flows bounced back sharply in June 2026, with net inflows of ₹16,724 crore reversing a rough patch that saw negative flows in April and barely-there flows in May. Folios grew 32.6% year-on-year and AUM grew 21.3%, both still strong numbers on paper. But look closer at the trajectory over the past few months, and the story is less about strength and more about deceleration from an unusually high base.
Out of the 12 passive fund categories AMFI tracks, 7 saw net inflows in June and 5 saw net outflows, a broad-based but not universal recovery. Equity index ETFs led AUM among passive categories, followed by equity index funds and gold ETFs.
| Passive Fund Category | Jun-26 Folios | YoY Folio Growth | Jun-26 AUM (₹ cr) | YoY AUM Growth | Net Flows (₹ cr) |
|---|---|---|---|---|---|
| Equity Index Funds (Domestic) | 1,48,74,987 | 14.66% | 2,31,678.28 | 21.24% | 2,860.28 |
| Equity Index Funds (International) | 2,88,918 | 23.40% | 8,097.87 | 46.73% | -13.54 |
| Debt Index Funds (TMIFs) | 1,73,142 | -4.03% | 87,327.56 | -15.14% | -2,001.85 |
| Debt Index Funds (Ex-TMIF) | 34,976 | 234.57% | 6,040.81 | 5.17% | -742.54 |
| Other Index Funds | 1,17,368 | 17.42% | 3,769.44 | 0.89% | -160.90 |
| Gold ETF | 1,24,75,958 | 63.00% | 1,70,148.42 | 162.67% | 3,443.24 |
| Equity Oriented ETFs (Domestic) | 1,89,31,335 | 16.08% | 7,81,044.22 | 7.53% | 8,576.34 |
| Equity Oriented ETFs (International) | 12,42,690 | 32.14% | 20,585.39 | 38.43% | 0.00 |
| Debt Oriented ETFs | 16,70,275 | -31.95% | 94,354.04 | -3.46% | 374.94 |
| Silver ETF | 53,92,787 | 492.45% | 78,943.78 | 289.14% | 4,286.47 |
| FOFs on Overseas Active Funds | 14,66,718 | 88.04% | 37,906.61 | 87.70% | 155.85 |
| FOFs on Overseas Passive Funds | 5,23,912 | -11.96% | 10,593.12 | 24.63% | -54.05 |
| Total Passive Funds | 5,71,93,066 | 32.57% | 15,30,489.55 | 21.30% | 16,724.26 |
Overall passive fund flows of ₹16,724 crore in June marked a sharp revival in investor interest, led by equity index ETFs, gold ETFs, and silver ETFs. Gold ETFs saw net inflows of ₹3,443 crore and silver ETFs saw net inflows of ₹4,287 crore, as bottom-fishing set in following the sharp correction in precious metals prices. Equity index ETFs saw robust inflows of ₹8,576 crore in June, even as debt-oriented index funds continued to witness steady outflows for a second straight month.
Global diversification through fund-of-funds structures continued to attract interest, though the more notable data point here is the sharp revival in folio accretion for FOFs investing in overseas active funds, up 88% year-on-year. The selling pressure in debt index ETFs looks tied less to bottom-fishing and more to concerns about a potential RBI rate hike aimed at countering rising inflation.
AUM captures the overall rupee impact of passive investing, but folio counts capture something different: the intensity of retail participation. AUM growth tends to move in cycles, tracking price movements as much as new money. Folio growth is a more secular, structural signal of how many individual investors are actually opening new positions.
Looking at folio growth year-on-year through June 2026, silver ETFs led by a wide margin at 492%, followed by non-TMIF debt index funds at 235%, FOFs on overseas active funds at 88%, and gold ETFs at 63%. The surge in gold and silver ETF folios traces back to the 46-year record returns both metals delivered in 2025, the best calendar year for gold since 1979. That momentum has slowed in recent months, but June saw a clear revival of retail interest in precious metals ETFs specifically.
Three passive categories saw folio contraction in June 2026: debt-oriented ETFs fell 32% year-on-year, FOFs on overseas passive funds fell 12%, and debt index TMIFs fell 4%. All three sit on the debt or overseas-passive side of the ledger, suggesting the pullback is concentrated in exactly the areas where rate and currency uncertainty bite hardest.
Silver ETFs led AUM growth at 289%, followed by gold ETFs at 163%. FOFs on overseas active funds also stood out, with AUM growth of 88% alongside their strong folio accretion.
The passive fund data for June 2026 points to three distinct threads. First, inflation concerns are weighing on debt ETFs, visible in both the folio contraction and the outflows across TMIF and Ex-TMIF categories. Second, there's a visible shift back toward passive equity as a strategy, reflected in the strong inflows into both domestic equity index funds and equity-oriented ETFs. Third, gold and silver ETFs are back on the investor radar after a quieter patch, though the pace of folio and AUM growth across passive funds overall has been tapering, partly due to a higher base effect from 2025's exceptional metals rally, and partly due to lingering concerns over FPI selling, geopolitical risk, and the broader market's focus on AI-linked themes elsewhere.
Passive mutual funds in India saw net inflows of ₹16,724 crore in June 2026, a sharp rebound after negative flows in April and near-flat flows in May.
Equity-oriented ETFs (domestic) led passive fund AUM at ₹7,81,044 crore, followed by domestic equity index funds and gold ETFs.
Gold ETFs saw ₹3,443 crore and silver ETFs saw ₹4,287 crore in net inflows during June 2026, largely attributed to bottom-fishing by investors following a sharp correction in precious metals prices after 2025's record rally.
Debt-oriented ETFs and debt index TMIFs continued to see net outflows in June 2026, a trend linked to investor concerns over a potential RBI rate hike to counter rising inflation, which would weigh on existing bond prices.
The pace of folio and AUM growth in passive funds has been tapering over recent months even though year-on-year growth rates remain strong, partly due to a higher base effect from 2025's exceptional precious metals rally and partly due to broader market uncertainties.
Disclaimer: This article is for general information and educational purposes only. It does not constitute investment advice, a recommendation, or an offer to buy or sell any securities or financial instruments. Passive fund flow data, folio counts, and AUM figures are sourced from AMFI and are subject to revision. Past performance and historical flow patterns in passive funds, ETFs, gold, silver, and debt instruments are not indicative of future outcomes. Investors should not make any investment decision based solely on this article. Please consult a SEBI-registered investment adviser or qualified financial professional before making any investment decision. Mutual fund investments are subject to market risks. Please read all scheme-related documents carefully before investing.
No spam. Only new posts, simple explainers, and practical money checklists for busy professionals.
Finnovate is a SEBI-registered financial planning firm that helps professionals bring structure and purpose to their money. Over 3,500+ families have trusted our disciplined process to plan their goals - safely, surely, and swiftly.
Our team constantly tracks market trends, policy changes, and investment opportunities like the ones featured in this Weekly Capsule - to help you make informed, confident financial decisions.
Learn more about our approach and how we work with you:
No comments yet. Start the conversation. What would you add?
No spam. Only new posts, simple explainers, and practical money checklists.
You may also like
Equity mutual funds received ₹29,329 crore in August 2026. See which categories saw the ...

When should you exit a mutual fund? Learn when to hold, stop a SIP, rebalance or redeem ba...

Mutual fund AUM rose ₹3.54 lakh crore in July 2026. See how much came from fresh inflows...

Small- and mid-cap funds drew nearly 7x more inflows than large-cap funds from February to...
Popular now

Learn how to easily download your NSDL CAS Statement in PDF format with our step-by-step g...

Looking for the best financial freedom books? Here’s a handpicked 2026 reading list with...

Learn what SIF investment means in India, SEBI rules, Rs 10 lakh minimum investment, avail...

Clear guide to mutual fund taxation in India for FY 2025–26 after July 2024 changes: equ...