

Quick Commerce's Urban Ceiling: Why Rural Commerce Is the Next Frontier
Quick commerce runs on dense urban clusters - a model that covers 8% of India's population...
24 June 2026
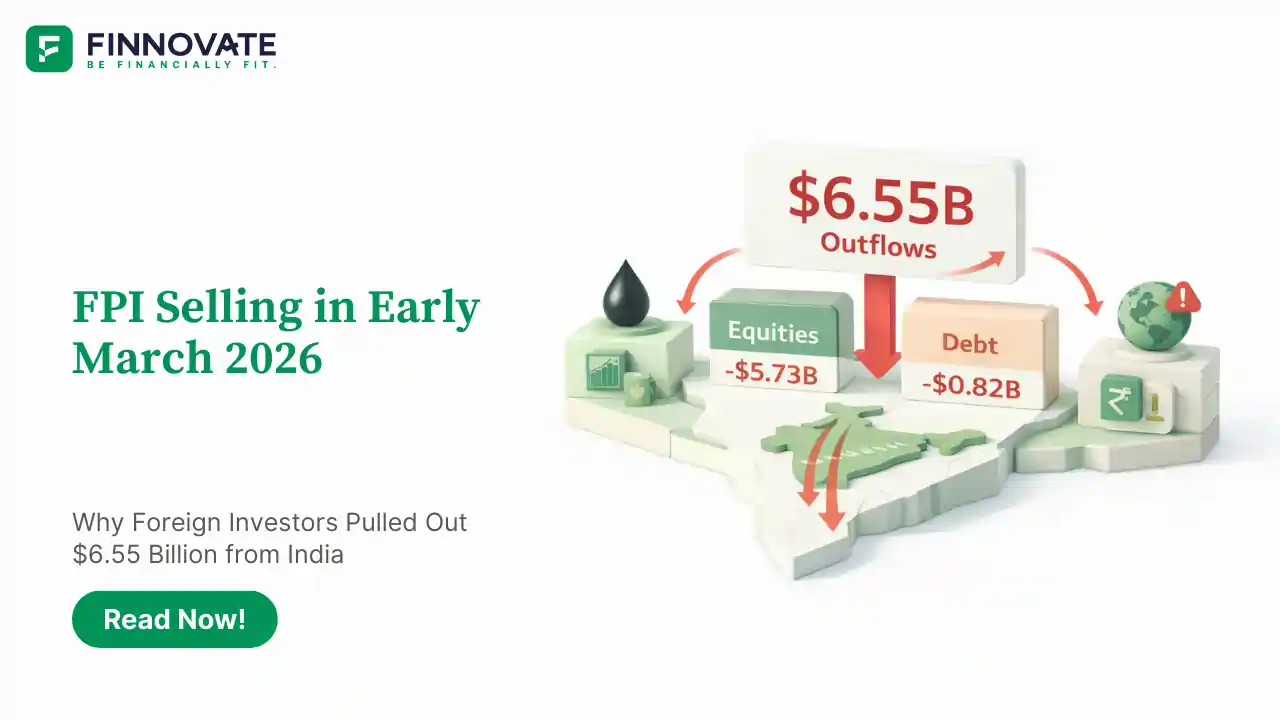
Foreign portfolio investors pulled out about $6.55 billion from Indian markets in the first nine trading days of March 2026. Of this, roughly $5.73 billion came from equities and about $820 million came from debt. The scale of selling was sharp enough to matter not just for market sentiment, but also for how foreign investors were reading India’s near-term macro risk.
What stands out even more than the headline number is the pattern. This was not a one-day panic move. FPIs were net sellers on every trading day in that stretch. That kind of consistency usually signals a broader risk-off phase rather than simple profit-booking. The key question now is whether this remains a geopolitical shock response or turns into a longer foreign de-risking cycle in Indian assets.
| Transaction Date | Equity Flows (₹ in Crore) | Primary IPO Flows (₹ Cr) | Overall Equity Flows (₹ Cr) | Debt Flows (₹ Crore) | FPI Flows (₹ Crore) |
|---|---|---|---|---|---|
| 02-Mar-26 | -6,831.95 | 1,364.48 | -5,467.47 | 873.50 | -4,593.97 |
| 04-Mar-26 | -3,070.55 | 81.90 | -2,988.65 | 1,067.76 | -1,920.89 |
| 05-Mar-26 | -9,288.05 | 174.63 | -9,113.42 | -2,028.32 | -11,141.74 |
| 06-Mar-26 | -3,441.05 | 10.80 | -3,430.25 | 268.14 | -3,162.11 |
| 09-Mar-26 | -6,379.65 | 30.55 | -6,349.10 | -1,259.91 | -7,609.01 |
| 10-Mar-26 | -6,577.66 | 9.70 | -6,567.96 | -1,392.41 | -7,960.37 |
| 11-Mar-26 | -5,643.80 | 143.97 | -5,499.83 | -2,484.05 | -7,983.88 |
| 12-Mar-26 | -5,911.90 | 0.00 | -5,911.90 | -2,493.93 | -8,405.83 |
| 13-Mar-26 | -7,311.10 | -63.95 | -7,375.05 | -116.46 | -7,491.51 |
| Total INR (Cr) | -54,455.71 | 1,752.08 | -52,703.63 | -7,565.68 | -60,269.31 |
| Total US$ (Mn) | -5,925.80 | 192.19 | -5,733.61 | -819.89 | -6,553.50 |
The first nine trading days of March saw total FPI outflows of about ₹60,269 crore. Within that, overall equity outflows stood at roughly ₹52,704 crore, while debt outflows came in at about ₹7,566 crore. In dollar terms, that works out to around $6.55 billion of total FPI selling.
This was large enough to coincide with visible damage in Indian markets. By mid-March, benchmark indices had slipped into correction territory as crude prices surged, the rupee weakened, and external risk sentiment deteriorated. That combination matters because FPI selling tends to become more intense when market stress is not limited to one asset class.
The daily flow pattern makes the message even clearer. Selling did not happen on just one or two volatile sessions. It continued through the entire period.
The weakest day in the table was 5 March 2026, when total FPI outflows crossed ₹11,141 crore. Other days also saw heavy selling. 12 March saw outflows of about ₹8,406 crore, 11 March about ₹7,984 crore, 10 March about ₹7,960 crore, and 13 March about ₹7,492 crore.
Primary market IPO flows offered a small offset on some sessions, but not enough to change the larger picture. Even after including IPO support, overall equity flows remained deeply negative throughout the period.
That persistence tells us that foreign investors were steadily cutting risk as the macro and geopolitical backdrop worsened. It was not a one-session reaction. It was a continued withdrawal.
The first driver was geopolitical stress. The widening conflict involving the U.S., Israel, and Iran pushed investors away from emerging markets and into safety. India got caught in that broader global risk-off move.
The second driver was oil. Brent moved above $100 per barrel during the March stress phase, and that quickly changed how investors were looking at India. Since India imports the vast majority of its crude needs, a sustained oil shock raises concerns about inflation, the current account, the rupee, and overall growth comfort.
The third driver was the rupee. The Indian currency fell to a record low near 92.48 per dollar in mid-March. For foreign investors, that is not a side issue. Even if local market performance holds up in rupee terms, a weaker currency reduces dollar returns and makes the risk-reward less attractive.
There was also growing concern around energy-linked business pressure. India’s exposure to Middle East energy routes became a bigger market issue as disruption around the Strait of Hormuz intensified. High oil and fuel costs started raising concern for margins, supply security, and operating costs across energy-sensitive sectors. The market reaction reflected that fear.
Foreign investors usually react sharply when three things hit at the same time: geopolitical stress, commodity spikes, and currency weakness. March 2026 had all three.
For India, higher oil is a direct macro problem because it raises the import bill and can worsen both inflation and the current account. If prices remain elevated for long enough, it can also squeeze fiscal room and put more pressure on domestic financial conditions. That makes India look more exposed during global stress even if the domestic economy is otherwise relatively stable.
The rupee matters for a simpler reason. A foreign investor measures returns in dollars, not rupees. So when the rupee weakens sharply, it can wipe out a chunk of gains or deepen losses, which is why currency stress often accelerates FPI selling.
And during geopolitical conflict, emerging markets often face faster outflows because capital tends to move toward perceived safety first. Valuation and long-term fundamentals usually get pushed aside in the short run. That is what the March flow pattern looks like so far.
Most of the March selling came from equities, and that remains the main headline. But debt outflows of roughly ₹7,566 crore, or about $820 million, were also meaningful. That matters because it shows foreign investors were reducing exposure across Indian financial assets, not just trimming stock positions.
When both equities and debt see outflows together, the message is usually broader than earnings or valuation discomfort. It points to concern around currency, rates, macro stability, and external risk. In that sense, early March did not look like a normal equity correction. It looked more like a wider foreign de-risking phase.
There are four broad ways this can evolve.
The first is a quick de-escalation. If conflict risk cools and oil prices ease, FPI selling could slow sharply and foreign flows may stabilise again.
The second is a prolonged but contained conflict. In that case, India may continue to face pressure from high oil, rupee weakness, and selective foreign selling without a full market breakdown.
The third is continued conflict with better shipping visibility. If energy routes become more stable even without a full resolution, markets may respond positively because oil and currency fears would likely ease.
The fourth is a deeper regional escalation. That would likely keep crude volatile, maintain pressure on the rupee, and increase the chance of further foreign selling across both equities and debt. At this stage, FPI behaviour is likely to remain highly sensitive to oil prices, rupee movement, and any shift in regional risk.
The first takeaway is that sharp FPI selling should not be treated as a final verdict on India’s long-term market story. A large part of the March move has been driven by external stress, not only by domestic weakness.
The second takeaway is more practical. When FPI outflows happen alongside rising crude, rupee weakness, and bond pressure, the signal is broader than just equity weakness. It points to a macro risk phase. That is the more useful way to read the data.
The third is that flow data should be used as a market stress indicator, not as a reason to react blindly to each daily headline. Persistent selling tells you foreign investors are uncomfortable. It does not automatically tell you what the final outcome will be once the external shock settles.
Because geopolitical stress, oil price spikes, and rupee weakness combined to make India look riskier in the short term for foreign investors.
In the first nine trading days of March 2026, equity outflows were about $5.73 billion and debt outflows were about $820 million.
Because India imports most of its crude needs. Higher oil raises concerns around inflation, the current account, fiscal cost, and the rupee, all of which affect foreign investor confidence.
Yes. The rupee fell to record lows in March, which reduced dollar returns for foreign investors and added to selling pressure.
Watch crude oil, rupee movement, bond yields, and whether geopolitical risk begins to cool or deepen. Those factors will likely decide whether FPI selling slows or continues.
Disclaimer: This article is for general information and educational purposes only. It does not constitute investment, tax, legal, or financial advice. Market conditions, policy signals, and economic data can change quickly. Please refer to official sources or speak to a qualified professional before taking action.
No spam. Only new posts, simple explainers, and practical money checklists for busy professionals.
Finnovate is a SEBI-registered financial planning firm that helps professionals bring structure and purpose to their money. Over 3,500+ families have trusted our disciplined process to plan their goals - safely, surely, and swiftly.
Our team constantly tracks market trends, policy changes, and investment opportunities like the ones featured in this Weekly Capsule - to help you make informed, confident financial decisions.
Learn more about our approach and how we work with you:


No spam. Only new posts, simple explainers, and practical money checklists.
You may also like
Quick commerce runs on dense urban clusters - a model that covers 8% of India's population...

The Fed held rates at 3.50%-3.75% on June 17, 2026. Warsh's first meeting as chair: a 130-...

FPIs sold $6.70 billion from Indian equities in H1 June 2026, reversing May's tapering tre...

Indian online shoppers lose ₹25,000-28,000 crore a year to dark patterns. 88% are affect...
Popular now
Learn how to easily download your NSDL CAS Statement in PDF format with our step-by-step g...
Learn what SIF investment means in India, SEBI rules, Rs 10 lakh minimum investment, avail...
Looking for the best financial freedom books? Here’s a handpicked 2026 reading list with...
Clear guide to mutual fund taxation in India for FY 2025–26 after July 2024 changes: equ...