
Top Performing Nifty 50 Stocks in September 2026
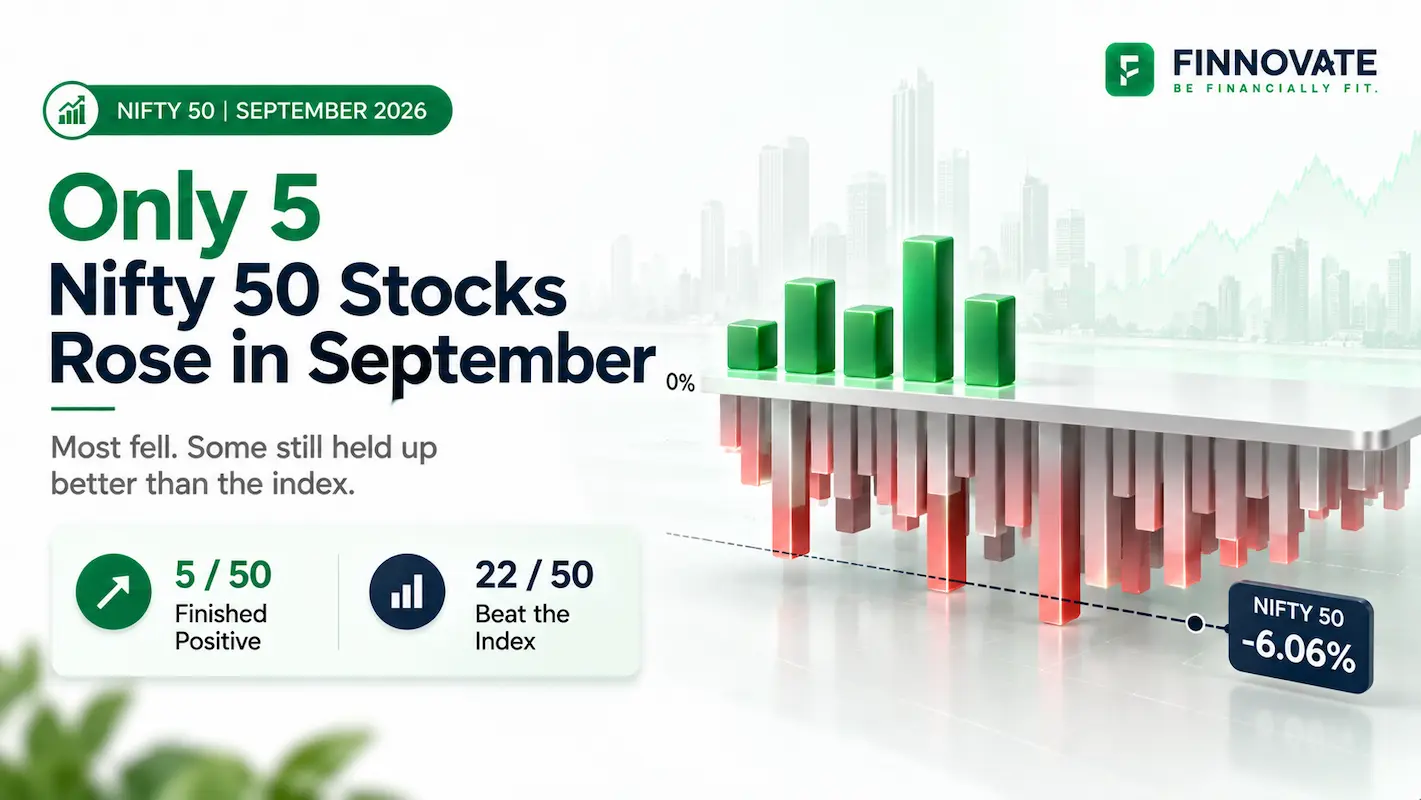
Only five Nifty 50 stocks rose in September 2026 as the index fell 6.06%. Compare monthly ...
08 October 2026


Finnovate’s editorial team researches and creates financial content using trusted sources, regulatory references and inputs from subject experts.
Nifty Midcap 100 closed June 2026 up 2.24% for the month and 4.43% higher than a year ago. On the surface, that reads like a routine month. It was not.
The real story sits in the index's round trip. From its lows of the year, Nifty Midcap 100 bounced 19.8%, and by month end it was trading within striking distance, less than 1%, of its 52-week high. Few indices move from near-panic to near-peak inside a single stretch without leaving a trail of dispersion beneath the surface.
To see where that dispersion showed up, we built a four-factor ranking model across Nifty Midcap 100 constituents, combining short-term momentum with longer-term resilience. Here is what the top-20 stocks by combined rank score look like, and what they reveal about where mid-cap strength actually concentrated.
| Rank | Company | 1-Month Return | 1-Year Return | Bounce from Low | Distance to Peak | Combined Rank Score |
|---|---|---|---|---|---|---|
| 1 | Laurus Labs | 10.34% | 101.59% | 130.07% | 0.37% | 3.00 |
| 2 | Federal Bank | 13.12% | 52.24% | 79.08% | 0.26% | 4.00 |
| 3 | Nykaa | 16.38% | 48.26% | 58.74% | 0.37% | 4.75 |
| 4 | Radico Khaitan | 13.72% | 57.44% | 58.64% | 0.51% | 7.00 |
| 5 | Bharat Forge | 12.77% | 63.63% | 94.99% | 4.12% | 8.00 |
| 6 | L&T Finance | 16.36% | 52.75% | 62.04% | 4.39% | 9.50 |
| 7 | AB Capital | 11.78% | 43.48% | 61.60% | 1.67% | 10.00 |
| 8 | Phoenix Mills | 17.71% | 34.38% | 43.24% | 0.81% | 11.25 |
| 9 | Aurobindo Pharma | 9.39% | 35.01% | 53.86% | 1.60% | 13.50 |
| 10 | AU Small Finance Bank | 8.15% | 29.06% | 54.80% | 2.18% | 14.25 |
| 11 | Vodafone Idea | 1.91% | 91.89% | 135.78% | 5.93% | 15.25 |
| 12 | GMR Airports | 14.14% | 26.71% | 35.02% | 2.30% | 17.00 |
| 13 | Oracle Financial Services (OFSS) | 5.97% | 22.58% | 75.83% | 2.78% | 17.00 |
| 14 | Prestige Estates | 19.96% | 4.48% | 53.52% | 7.75% | 17.00 |
| 15 | Paytm | 13.12% | 30.72% | 36.25% | 12.33% | 22.00 |
| 16 | GE Vernova T&D | 1.03% | 102.27% | 113.25% | 14.51% | 22.25 |
| 17 | Polycab India | 1.06% | 42.33% | 51.80% | 4.87% | 22.75 |
| 18 | BHEL | -2.01% | 54.45% | 96.23% | 5.27% | 25.50 |
| 19 | Motilal Oswal Financial Services | 10.64% | 11.95% | 55.81% | 12.67% | 26.00 |
| 20 | Groww | 7.96% | 0.00% | 83.93% | 9.33% | 26.25 |
The ranking combines two short-term factors, 1-month returns and proximity to peak price, with two long-term factors, 1-year returns and the bounce from the year's lows, the latter capturing how much resilience a stock has shown since its weakest point. Each stock is ranked across all four categories, and the average rank determines its position in the table above, giving a fuller picture than any single metric could on its own.
The averages tell only part of the story. The swing from peak across these 20 top-ranked Nifty Midcap 100 stocks averaged a modest 4.7%, meaning most of the list is trading close to its own 52-week high, not just off a low base. That combination, strong bounce and proximity to peak together, is a more demanding bar than either factor alone.
Seven of the top 20 stocks came from the financial inclusion space: Federal Bank, L&T Finance, AB Capital, AU Small Finance Bank, Paytm, Motilal Oswal Financial Services, and Groww. These are domestically oriented businesses, and their concentration at the top reflects greater channelling of household savings into formal financial products and services.
Three names, GE Vernova T&D, Polycab India, and BHEL, represented the power equipment space. A domestic shortfall in power equipment supply has kept quality electrical goods manufacturers commanding premium valuations.
Laurus Labs and Aurobindo Pharma gained on continued CDMO momentum, while Phoenix Mills and Prestige Estates reflected the expanding demand for premium housing across Indian cities.
68 mid-cap stocks delivered positive 1-month returns against 32 that gave negative returns, a broad-based participation for the month.
Only 47 mid-cap stocks delivered positive 1-year returns, meaning the recent momentum has been considerably more broad-based than the trailing 12-month picture, where a slim majority of names are still underwater.
That gap between 1-month breadth and 1-year breadth is the clearest signal in this data set. Whatever is driving mid-caps right now looks concentrated in recent months rather than reflecting a year-long structural trend, consistent with a market rewarding recent selectivity rather than broad conviction, a pattern sometimes described as alpha hunting.
Why this matters: a headline monthly return can look identical whether it comes from broad, durable participation or from a narrow set of stocks doing the heavy lifting. The gap between this month's breadth and the trailing year's breadth is what tells the two apart, and it is the detail that a single index-level number would otherwise hide.
The stocks ranked lowest in the overall model included several IT names, KPIT Technologies, Tata Elxsi, and Persistent Systems, alongside a mix of consumer-facing businesses: Patanjali Foods, Swiggy, IRCTC, Jubilant Foodworks, SBI Cards, and Godfrey Phillips. This spread across sectors suggests the laggards were not concentrated in any single theme, reinforcing that June 2026's mid-cap strength was a selective, factor-driven move rather than an across-the-board rally.
The dispersion in this month's data, strong resilience concentrated in specific sectors while nearly half the index remains below its levels of a year ago, is the kind of pattern that historically favours selective stock or fund exposure over a single broad-based view of the mid-cap segment. Readers evaluating active versus passive approaches to portfolio management may find this kind of return dispersion a useful data point, since wide gaps between winners and laggards within an index segment are typically where active selection has more room to add value relative to a passive benchmark.
Past performance of these stocks is not indicative of future returns, and this ranking reflects historical price behaviour only, not a recommendation for any individual security.
| Indicator | Why It Matters |
|---|---|
| Whether 1-year breadth improves beyond 47 stocks | Shows whether June's strength is broadening into a durable trend or staying concentrated in a narrow set of names |
| Distance-to-peak for financial inclusion names | Several of these stocks are within 1 to 2% of their 52-week highs, so a pullback here would signal the leading theme is losing steam |
| Whether IT and consumer-facing laggards begin to recover | A rotation into these sectors would suggest the rally is broadening rather than staying factor-driven |
Nifty Midcap 100 closed June 2026 up 2.24% month-on-month and 4.43% higher year-on-year, having bounced 19.8% from its lows of the year.
Based on a combined ranking of 1-month returns, 1-year returns, bounce from lows, and proximity to peak, Laurus Labs, Federal Bank, and Nykaa led the Nifty Midcap 100 rankings.
Seven of the top-20 ranked stocks, including Federal Bank, L&T Finance, and AU Small Finance Bank, came from the financial inclusion space, reflecting greater domestic savings flowing into formal financial products.
Not necessarily. Only 47 of the index's constituents delivered positive returns over the trailing year, meaning June's strength was more concentrated than broad-based. Please consult a SEBI-registered investment adviser before making any investment decision based on index-level or stock-level data.
Bounce from low measures how far a stock has recovered from its lowest price point in the past year, while distance to peak measures how close it currently trades to its highest price point in the same period. Together, they indicate resilience and current momentum.
Disclaimer: This article is for general information and educational purposes only. It does not constitute investment advice, a recommendation, or an offer to buy or sell any securities or financial instruments. Stock and index data referenced in this article are based on publicly available sources and Finnovate Research, and are subject to revision. Past market behaviour and stock performance are not indicative of future outcomes. Investors should not make any investment decision based solely on this article. Please consult a SEBI-registered investment adviser or qualified financial professional before making any investment decision. Equity investments are subject to market risks.
No spam. Only new posts, simple explainers, and practical money checklists for busy professionals.
Finnovate is a SEBI-registered financial planning firm that helps professionals bring structure and purpose to their money. Over 3,500+ families have trusted our disciplined process to plan their goals - safely, surely, and swiftly.
Our team constantly tracks market trends, policy changes, and investment opportunities like the ones featured in this Weekly Capsule - to help you make informed, confident financial decisions.
Learn more about our approach and how we work with you:
No comments yet. Start the conversation. What would you add?
No spam. Only new posts, simple explainers, and practical money checklists.
You may also like
Only five Nifty 50 stocks rose in September 2026 as the index fell 6.06%. Compare monthly ...

Why did hospital stocks fall after Supreme Court scrutiny of medicine prices? Understand d...

Nifty Smallcap 100 rose 3.16% in August 2026. See which small-cap stocks led, what drove t...

Nifty Midcap 100 rose 2.15% in August 2026. See which mid-cap stocks led the rally, key se...
Popular now

Learn how to easily download your NSDL CAS Statement in PDF format with our step-by-step g...

Looking for the best financial freedom books? Here’s a handpicked 2026 reading list with...

Learn what SIF investment means in India, SEBI rules, Rs 10 lakh minimum investment, avail...

Clear guide to mutual fund taxation in India for FY 2025–26 after July 2024 changes: equ...