

Oil Above $100: Rupee, RBI and What India Can Absorb
Brent crossed $100 on July 24, 2026. The rupee hit ₹96.80. India has $675bn in reserves ...
24 July 2026
Data period: Month ending May 30, 2026
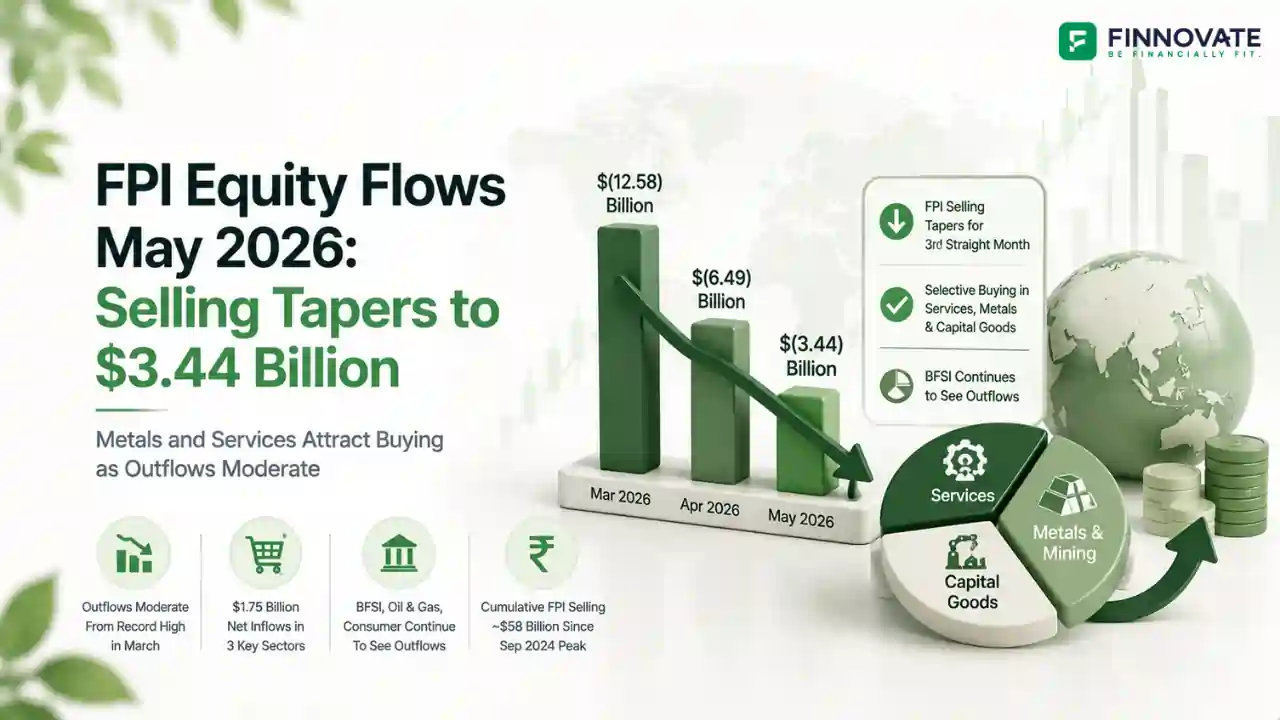
FPI equity selling in India continued for the third consecutive month in May 2026 but at a materially reduced pace. Net outflows of ₹32,963 crore (approximately $3.44 billion) in May followed ₹60,847 crore in April and a record ₹1,17,775 crore in March. The selling intensity has roughly halved each month since the March peak.
Selling remained broad-based across 18 of 23 sectors, but buying returned in meaningful size to three sectors: Services, Metals and Mining, and Capital Goods together attracted approximately $1.75 billion of net FPI inflows. BFSI continued to dominate the sell side, absorbing 70% of net outflows.
Quick read: The tapering of FPI selling from $12.58 billion in March to $6.49 billion in April to approximately $3.44 billion in May is a directional signal, but the structural reasons for FPI caution on India have not changed. BFSI, oil and gas, and consumer sectors saw continued outflows. Services, metals, and capital goods drew selective buying. Cumulative FPI equity selling since the September 2024 peak now stands at approximately $58 billion per NSDL data, with equity AUC declining 23.7% from $931 billion to $710 billion over that period.
Net selling was recorded in 18 of 23 sectors. Five sectors registered net inflows. The table below shows the full NSDL sectoral breakdown.
| Sector | Net FPI Flow ($ Million) | Direction |
|---|---|---|
| Financial Services (BFSI) | -2,415 | Selling |
| Oil, Gas and Fuels | -937 | Selling |
| Fast Moving Consumer Goods | -372 | Selling |
| Automobile and Components | -265 | Selling |
| Consumer Services | -209 | Selling |
| Information Technology | -199 | Selling |
| Construction Materials | -171 | Selling |
| Consumer Durables | -151 | Selling |
| Construction | -126 | Selling |
| Others | -111 | Selling |
| Power | -71 | Selling |
| Chemicals | -64 | Selling |
| Realty | -42 | Selling |
| Telecommunication | -42 | Selling |
| Media and Entertainment | -13 | Selling |
| Textiles | -8 | Selling |
| Utilities | -5 | Selling |
| Forest Materials | -4 | Selling |
| Diversified | +2 | Marginal buying |
| Healthcare | +19 | Buying |
| Capital Goods | +292 | Buying |
| Metals and Mining | +701 | Buying |
| Services | +751 | Buying |
| Grand Total | -3,440 | Net Selling |
The sectoral pattern in May 2026 is largely consistent with the pattern seen in March and April. The same structural pressures drove selling; the same commodity and infrastructure themes drew buying.
Financial Services continues to bear the heaviest FPI selling. BFSI absorbed $2,415 million of the $3,440 million total outflow in May, representing 70.2% of net selling. One likely driver is passive ETF rebalancing linked to MSCI EM weight reductions. As India's MSCI EM weight has fallen from approximately 20% in September 2024 to 11.94% as of April 30, 2026, passive index funds mechanically reduce allocations to the largest and most liquid constituents, which are concentrated in BFSI.
The Middle East conflict has kept crude oil prices elevated and created direct fuel subsidy pressure for downstream players. FPIs trimmed oil and gas holdings as the subsidy burden weighs on earnings visibility for downstream companies and adds to fiscal pressure on the government.
FMCG ($372 million), Consumer Services ($209 million), and Consumer Durables ($151 million) together saw $732 million in net outflows. Elevated inflation from fuel and food prices is seen compressing purchasing power, reducing near-term earnings visibility for consumer-facing businesses.
Supply chain disruptions from the Middle East conflict created input delays and freight cost spikes. Automobile and Components ($265 million), Construction ($126 million), and Construction Materials ($171 million) saw combined net selling of $562 million as import-dependent and freight-sensitive businesses faced margin pressure.
A weak rupee would typically support IT sector earnings through better dollar revenue translation. Despite this, FPIs trimmed IT holdings at $199 million. One possible headwind is AI disruption risk to traditional software services revenue models, rather than the rupee or demand cycle.
Transport, logistics, and knowledge process outsourcing (KPO) services attracted the largest FPI buying in May 2026. This buying may reflect investor preference for businesses that could benefit from changing trade routes and India's structural competitiveness in services exports. This is a sector where India has direct beneficiary exposure to the same geopolitical disruptions that are pressuring other segments.
Global commodity supply disruption has maintained metal pricing tailwinds. FPIs have been consistent buyers of Indian metals and mining stocks across February, March, April, and now May 2026. India's domestic metal producers benefit from both pricing and supply re-routing dynamics linked to the Middle East conflict.
Domestic infrastructure spending continues to support capital goods demand independently of global volatility. Power equipment, industrial machinery, and defence manufacturing have maintained FPI interest as domestically-driven businesses with lower exposure to FPI selling triggers like MSCI rebalancing and rupee pressure.
| Metric | September 2024 (Peak) | May 2026 | Change |
|---|---|---|---|
| FPI Equity AUC | $931 billion | $710 billion | -23.7% |
| Overall FPI AUC (incl. debt) | $1,007 billion | $784 billion | -22.1% |
| India MSCI EM weight | ~20% (peak) | 11.94% (Apr 30, 2026) | -8 percentage points |
| Cumulative net equity selling | Base | ~$58 billion | Sustained outflow |
The $26 billion of FPI equity selling in the first five months of CY2026 represents the sharpest five-month outflow period on record. Even in the context of the full $58 billion sold since September 2024, the 2026 pace has been concentrated and intense. The key question for the remainder of 2026 is whether May's tapering continues or whether it was a temporary moderation.
For the sector-wise breakdown of prior months, see FPI Selling in March 2026 and FPI Flows April 2026. For the MSCI EM weight mechanics driving passive selling, see MSCI EM Index: How India Lost FPI Flows to Taiwan and South Korea.
Even if geopolitical tensions ease, crude oil prices may remain elevated due to supply chain reconfiguration, and the rupee may remain vulnerable. India's import bill and current account position are structurally exposed to the commodity environment regardless of whether the conflict formally de-escalates. The FPI calculus on India does not automatically improve with a ceasefire.
India's position among emerging market equity destinations has weakened since the September 2024 peak. The MSCI EM index weight decline from approximately 20% to 11.94% reflects India's relative market performance versus Taiwan and South Korea, where AI semiconductor demand has driven strong equity returns. India's limited direct exposure to the AI infrastructure cycle continues to weigh on its relative attractiveness to global emerging market capital.
FPI buying in May 2026 was concentrated in three sectors: Services, Metals, and Capital Goods. This pattern has been consistent across multiple months. It reflects a clear FPI view: sectors with domestic demand visibility or commodity cycle tailwinds are being accumulated, while globally-exposed or consumer-dependent sectors are being reduced. The buying is not broad-based, but it is deliberate.
Persistent FPI outflows affect markets, sectors, and individual stocks differently. The FinnFit Financial Fitness Test takes 3 minutes and shows you where your portfolio stands across sectors, risk exposure, and goal alignment.
Take the FinnFit TestMonthly FPI selling fell from a record $12.58 billion in March to $6.49 billion in April and approximately $3.44 billion in May. The moderation reflects some stabilisation in global risk sentiment after March's concentrated sell-off, a partial recovery in Indian equity markets reducing mark-to-market pressure, and a natural reduction in MSCI rebalancing-driven passive selling after the May 29 rebalancing. However, the structural reasons for FPI caution on India, including declining MSCI EM weight and geopolitical commodity pressures, have not changed.
BFSI stocks are the most heavily weighted, most liquid, and most internationally held segment of the Indian equity market. When passive index funds linked to MSCI EM reduce India allocations, they sell the most liquid large-cap holdings first, and BFSI dominates that universe. In May 2026, BFSI absorbed $2,415 million or 70.2% of total FPI equity outflows despite comprising a much smaller share of overall NSDL-tracked sectors.
Metals and Mining and Services have benefited from the same Middle East conflict dynamics that are hurting other sectors. Metal prices have been supported by supply disruption tailwinds, making Indian producers direct commodity cycle beneficiaries. Services companies in transport, logistics, and KPO benefit from both freight demand and India's structural cost competitiveness. These are domestic or commodity-linked businesses with less exposure to the passive ETF rebalancing that drives BFSI selling.
FPI equity AUC falling from $931 billion to approximately $710 billion since September 2024 reflects a combination of active selling ($58 billion net) and the fall in market prices and rupee value. AUC decline means FPIs collectively hold less economic exposure to Indian equities. The domestic institutional base (mutual funds, insurance, pension funds) has partially offset this by absorbing FPI selling, which has provided market support. However, sustained AUC decline does weigh on sentiment and rupee stability.
A sustained FPI return would likely require stabilisation or recovery in India's MSCI EM weight, crude oil moderation, rupee recovery, and positive earnings surprises from BFSI and IT sectors. At the end of May 2026, the monthly selling intensity was tapering, but none of the structural conditions for a sustained reversal had been firmly established. Past FPI flow patterns are not indicative of future flows. Please consult a SEBI-registered investment adviser before making any investment decision based on FPI flow trends.
Disclaimer: This article is for general information and educational purposes only. It does not constitute investment advice, a recommendation, or an offer to buy or sell any securities or financial instruments. All sector-wise FPI flow data referenced in this article is sourced from NSDL's sector-wise FPI investment reports for May 2026. AUC figures are per NSDL data. Monthly flow figures are in USD millions unless stated otherwise. Past FPI flow patterns are not indicative of future flows. Please consult a SEBI-registered investment adviser or qualified financial professional before making any investment decision. Equity investments are subject to market risks.
No spam. Only new posts, simple explainers, and practical money checklists for busy professionals.
Finnovate is a SEBI-registered financial planning firm that helps professionals bring structure and purpose to their money. Over 3,500+ families have trusted our disciplined process to plan their goals - safely, surely, and swiftly.
Our team constantly tracks market trends, policy changes, and investment opportunities like the ones featured in this Weekly Capsule - to help you make informed, confident financial decisions.
Learn more about our approach and how we work with you:
No comments yet. Start the conversation. What would you add?
No spam. Only new posts, simple explainers, and practical money checklists.
You may also like
Brent crossed $100 on July 24, 2026. The rupee hit ₹96.80. India has $675bn in reserves ...

India has identified $51 billion of imports across 100 products for domestic manufacturing...

Over $300 billion in global drug revenue loses exclusivity by 2030. India's generic base i...

The US proposes 100% tariffs on India for buying Russian oil, down from an earlier 500%. N...
Popular now

Learn how to easily download your NSDL CAS Statement in PDF format with our step-by-step g...

Learn what SIF investment means in India, SEBI rules, Rs 10 lakh minimum investment, avail...

Looking for the best financial freedom books? Here’s a handpicked 2026 reading list with...

Clear guide to mutual fund taxation in India for FY 2025–26 after July 2024 changes: equ...