

Oil Above $100: Rupee, RBI and What India Can Absorb
Brent crossed $100 on July 24, 2026. The rupee hit ₹96.80. India has $675bn in reserves ...
24 July 2026
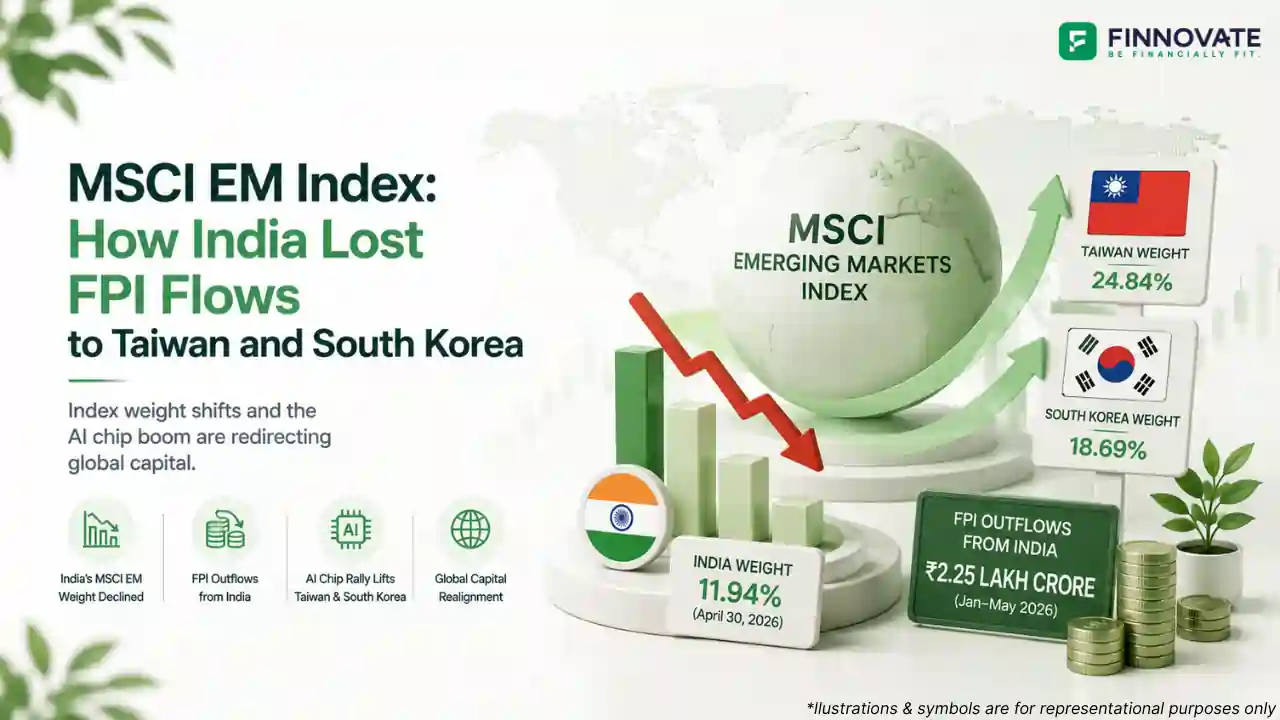
Foreign investors pulled ₹2.25 lakh crore from Indian equities by May 29, 2026, already exceeding the ₹1.66 lakh crore in outflows recorded across the entire year 2025. The headline number has attracted considerable attention, but the more important story is structural. This is not a standard risk-off rotation. It is a realignment of global emerging market capital driven by two forces: a mechanical shift in India's weight in the MSCI Emerging Markets index, and an AI-fuelled semiconductor rally that has made Taiwan and South Korea significantly more attractive to the same pool of investors.
This article explains the mechanics behind that shift: how index weights drive both passive and active fund allocations, why India's weight declined sharply from its 2024 peak, and what the outperformance of TSMC, Samsung Electronics, and SK Hynix means for FPI flows into India.
Quick answer: Foreign investors selling India and buying Taiwan and South Korea are largely following the MSCI Emerging Markets index. India's weight in this index fell from a peak of approximately 20% in mid-2024 to 11.94% as of April 30, 2026, creating pressure for passive funds benchmarked to MSCI EM to reduce India exposure over time. Simultaneously, sharp market capitalisation gains in TSMC, SK Hynix, and Samsung Electronics on AI chip and memory demand increased Taiwan and South Korea's index weights, pulling incremental EM allocation in their direction.
| Month | Net Flow | Direction |
|---|---|---|
| January 2026 | -₹35,962 crore | Outflow |
| February 2026 | +₹22,615 crore | Inflow |
| March 2026 | -₹1,17,775 crore | Outflow (record) |
| April 2026 | -₹60,847 crore | Outflow |
| May 2026 (till 29 May) | -₹32,963 crore | Outflow |
| Jan–May 2026 Total (till 29 May) | -₹2,24,932 crore (~₹2.25 lakh crore) | Net Outflow |
| Country | MSCI EM Weight (April 30, 2026) |
|---|---|
| Taiwan | 24.84% |
| China | 23.05% |
| South Korea | 18.69% |
| India | 11.94% |
The MSCI Emerging Markets index tracks 1,204 companies across 24 emerging market countries in Asia, Latin America, and Eastern Europe. It covers approximately 85% of the free-float adjusted market capitalisation in each country. What makes it significant for India goes beyond the fact that Indian companies are included: the index assigns a country weight, and that weight directly determines how much capital flows into that country's equity market.
Passive funds, including index funds and ETFs benchmarked to the MSCI EM, allocate to each country in proportion to its weight. When India's weight falls, passive funds are mechanically required to reduce their India holdings, regardless of any view on India's fundamentals. The assets tracking the MSCI EM index run into hundreds of billions of dollars globally. A shift of even one percentage point in India's weight can translate into billions of dollars in passive outflows.
Active long-only funds operate differently but are not immune to the same dynamic. These funds report their India exposure as overweight or underweight relative to the MSCI EM benchmark. A fund that holds India at 14% when the index weight is 12% is two percentage points overweight. As active managers reassess whether that overweight is justified, many have moved toward benchmark weight or below, generating discretionary selling that compounds the passive outflows.
For a deeper look at how passive benchmarking shapes fund flows in the Indian context, see Passive Fund Flows in India: Trend or Momentum.
India's weight in the MSCI EM index stood at approximately 9% in 2020. Over the next four years, a combination of strong earnings growth, robust domestic consumption, and sustained foreign interest drove a multi-year equity market rally. By mid-2024, India's weight had climbed to approximately 20%, its highest level ever, briefly threatening to close the gap with China.
That peak marked the turning point. Since September 2024, Indian equities underperformed sharply relative to the broader MSCI EM index. The Nifty 50 declined meaningfully from its September 2024 highs, while markets in Taiwan and South Korea surged on the back of AI semiconductor demand. As India's relative market capitalisation fell, its index weight also declined: from approximately 20% at peak to 11.94% by April 30, 2026, its lowest level in more than six years.
The quarter-by-quarter weight shift across the four largest MSCI EM constituents makes the divergence visible:
| Period | India (%) | China (%) | Taiwan (%) | South Korea (%) |
|---|---|---|---|---|
| Q4 2024 | 19.4 | 27.8 | 19.7 | 9.0 |
| Q1 2025 | 18.5 | 31.3 | 16.9 | 9.0 |
| Q2 2025 | 18.1 | 28.4 | 18.9 | 10.7 |
| Q4 2025 | 15.3 | 27.6 | 20.6 | 13.3 |
| Q1 2026 | 12.6 | 25.3 | 22.5 | 15.5 |
| May 2026 | 12.0 | 19.0 | 25.0 | 19.0 |
The heavy selling pressure around May 29, 2026 coincided with MSCI index rebalancing. Passive funds typically adjust holdings around such dates to reflect changes in index weights, and active funds may also position ahead of the rebalance. Both effects can add to market volatility around rebalancing windows, a structural feature of index-linked investing rather than a one-off event.
The table above makes the counterpart movement clear. Taiwan's weight nearly doubled from 19.7% in Q4 2024 to 25% by May 2026. South Korea's weight more than doubled from 9% to 19% over the same period. In a benchmark index, country weights are relative. When Taiwan and South Korea gain weight because their market capitalisation rises faster than the rest of the index, India's share can fall even if India remains a large market in absolute terms.
The incremental EM allocation that has moved away from India has not dispersed into cash. A substantial portion has favoured Taiwan and South Korea, concentrated in three companies that together account for 24.29% of the MSCI EM index as of April 30, 2026: TSMC of Taiwan, Samsung Electronics of South Korea, and SK Hynix of South Korea.
These three companies are the primary infrastructure suppliers for the global AI buildout. TSMC manufactures the advanced chips that power AI accelerators from Nvidia, Apple, and others. Samsung Electronics and SK Hynix produce the high-bandwidth memory that AI servers require in large quantities. As hyperscalers including Microsoft, Google, Amazon, and Meta have committed to multi-year AI infrastructure investment programmes, demand for chips and memory has risen sharply and predictably.
The stock market performance of these three companies reflects the scale of that demand. TSMC and SK Hynix have seen sharp multi-year gains as investors priced in AI-led chip and high-bandwidth memory demand. Samsung Electronics has also seen renewed investor interest driven by memory and AI-related chip demand. Their combined market capitalisation surge is what mechanically increased Taiwan and South Korea's MSCI EM weights. The flows followed the weights.
| Company | Country | AI Role | MSCI EM Weight (Apr 30, 2026) |
|---|---|---|---|
| TSMC | Taiwan | Advanced chip manufacturing for AI accelerators | 14.21% |
| Samsung Electronics | South Korea | Memory chips and AI server components | 6.03% |
| SK Hynix | South Korea | High-bandwidth memory (HBM) for AI servers | 4.05% |
The FPI outflows from India are not simply a function of index mechanics. The weight decline reflects a deeper relative valuation and earnings story, one that involves two structural pressures operating against India in the current global environment.
India's equity market is heavily represented by IT services companies, banks, and consumption-oriented businesses. None of these are direct beneficiaries of the AI infrastructure buildout in the way that chip manufacturers in Taiwan and South Korea are. India's IT sector, in fact, faces a more complex picture: AI has the potential to automate significant portions of the software services work that has historically driven Indian IT revenues. The near-term demand visibility that benefits TSMC and SK Hynix does not extend to India's largest listed companies in the same way.
India is a net energy importer. Any sustained rise in global commodity prices, crude oil in particular, compresses India's current account and adds to imported inflation, which in turn pressures corporate margins and consumer spending. The same geopolitical factors that have kept commodity prices elevated in 2026 have not generated a corresponding revenue or earnings tailwind for Indian companies. India absorbs the cost without capturing the upside that commodity-exporting emerging markets receive.
Together, these two factors represent what market participants have described as a double whammy: India has limited exposure to the primary beneficiary pool of the AI trade, while remaining exposed to the commodity cost pressures that accompany the same global environment. This combination has made the active fund underweight case for India more compelling than it has been at any point in the current market cycle.
A weight decline in the MSCI EM index is not permanent. India's weight rose from approximately 9% in 2020 to 20% in 2024 precisely because its equity market outperformed on a sustained basis. A reversal of the current weight decline would require Indian equities to outperform the MSCI EM benchmark consistently. Historically, this has occurred when domestic earnings growth accelerates and global capital rotates away from its current concentration in semiconductors.
Several factors could support a re-rating over time. A moderation in global commodity prices would ease India's current account pressure. A broader AI demand cycle extending beyond infrastructure hardware into software, services, and applications could bring India's IT sector back into the beneficiary column. Domestic macroeconomic stability, supported by RBI policy, fiscal consolidation, and consumption recovery, remains a relative strength that long-term active managers continue to cite.
What the current period reflects is a relative performance gap, not a structural exit from India as an investment destination. Aggregate foreign holdings in Indian equities have declined, but the domestic institutional base, comprising mutual funds, insurance companies, and pension funds, has absorbed a significant portion of the FPI selling. The market has demonstrated an ability to find support from local capital even during sustained foreign selling, a structural change that was not present in earlier FPI outflow cycles.
For context on how FPI flows have behaved in earlier periods of selling, see FPI Flows October 2025: India Sector Trends and FPI Outflows December 2025: Sectoral Analysis.
FPI flows, index rebalancing, and sector rotations affect portfolios in ways that are rarely visible until a review is done. The FinnFit Financial Fitness Test takes 3 minutes and shows you where you stand.
Take the FinnFit TestThe MSCI Emerging Markets index tracks 1,204 companies across 24 countries and assigns a weight to each country based on its equity market size. Passive funds benchmarked to the index allocate capital in proportion to those weights automatically. When India's weight declines, passive funds reduce their India holdings without any discretionary decision. Active funds also use MSCI EM weights as their overweight or underweight benchmark, so a lower weight pulls active capital in the same direction.
India's weight peaked at approximately 20% in mid-2024 after a multi-year equity market rally. Since then, Indian equities have underperformed the broader MSCI EM benchmark, while markets in Taiwan and South Korea have surged on AI semiconductor demand. As India's relative market capitalisation fell, its index weight declined to 11.94% as of April 30, 2026, its lowest level in more than six years.
Three semiconductor companies have driven the bulk of the weight gain: TSMC of Taiwan, the world's leading chipmaker and primary manufacturer of AI accelerator chips; and Samsung Electronics and SK Hynix of South Korea, both dominant producers of high-bandwidth memory used in AI servers. Their market capitalisation surges have increased Taiwan and South Korea's combined MSCI EM weight by nearly 18 percentage points since early 2025.
India's equity market has limited direct exposure to AI semiconductor demand, which has been the primary driver of global equity outperformance in 2024 and 2025. At the same time, India's large IT services sector faces potential revenue pressure from AI automation of software services work. India also remains a net energy importer, making it vulnerable to commodity cost inflation without a corresponding earnings tailwind from the same global dynamics.
India's weight has recovered before: it rose from approximately 9% in 2020 to 20% in 2024 on sustained equity market outperformance. A similar recovery would require Indian equities to consistently outperform the MSCI EM benchmark, which historically has accompanied accelerating domestic earnings growth and a broadening of the AI demand cycle beyond hardware into software and services. Please consult a SEBI-registered investment adviser before making any investment decision based on these projections.
Disclaimer: This article is for general information and educational purposes only. It does not constitute investment advice, a recommendation, or an offer to buy or sell any securities or financial instruments. FPI flow data referenced in this article is sourced from NSDL via publicly available reports. MSCI index weight data is sourced from official MSCI factsheets and publicly available market reports based on MSCI EM Index data. Stock performance data is sourced from publicly available sources and Finnovate Research. Past market behaviour and index weight movements are not indicative of future outcomes. Please consult a SEBI-registered investment adviser or qualified financial professional before making any investment decision. Equity investments are subject to market risks.
No spam. Only new posts, simple explainers, and practical money checklists for busy professionals.
Finnovate is a SEBI-registered financial planning firm that helps professionals bring structure and purpose to their money. Over 3,500+ families have trusted our disciplined process to plan their goals - safely, surely, and swiftly.
Our team constantly tracks market trends, policy changes, and investment opportunities like the ones featured in this Weekly Capsule - to help you make informed, confident financial decisions.
Learn more about our approach and how we work with you:
No comments yet. Start the conversation. What would you add?
No spam. Only new posts, simple explainers, and practical money checklists.
You may also like
Brent crossed $100 on July 24, 2026. The rupee hit ₹96.80. India has $675bn in reserves ...

India has identified $51 billion of imports across 100 products for domestic manufacturing...

Over $300 billion in global drug revenue loses exclusivity by 2030. India's generic base i...

The US proposes 100% tariffs on India for buying Russian oil, down from an earlier 500%. N...
Popular now

Learn how to easily download your NSDL CAS Statement in PDF format with our step-by-step g...

Learn what SIF investment means in India, SEBI rules, Rs 10 lakh minimum investment, avail...

Looking for the best financial freedom books? Here’s a handpicked 2026 reading list with...

Clear guide to mutual fund taxation in India for FY 2025–26 after July 2024 changes: equ...