

Quick Commerce's Urban Ceiling: Why Rural Commerce Is the Next Frontier
Quick commerce runs on dense urban clusters - a model that covers 8% of India's population...
24 June 2026
Last reviewed: May 2026
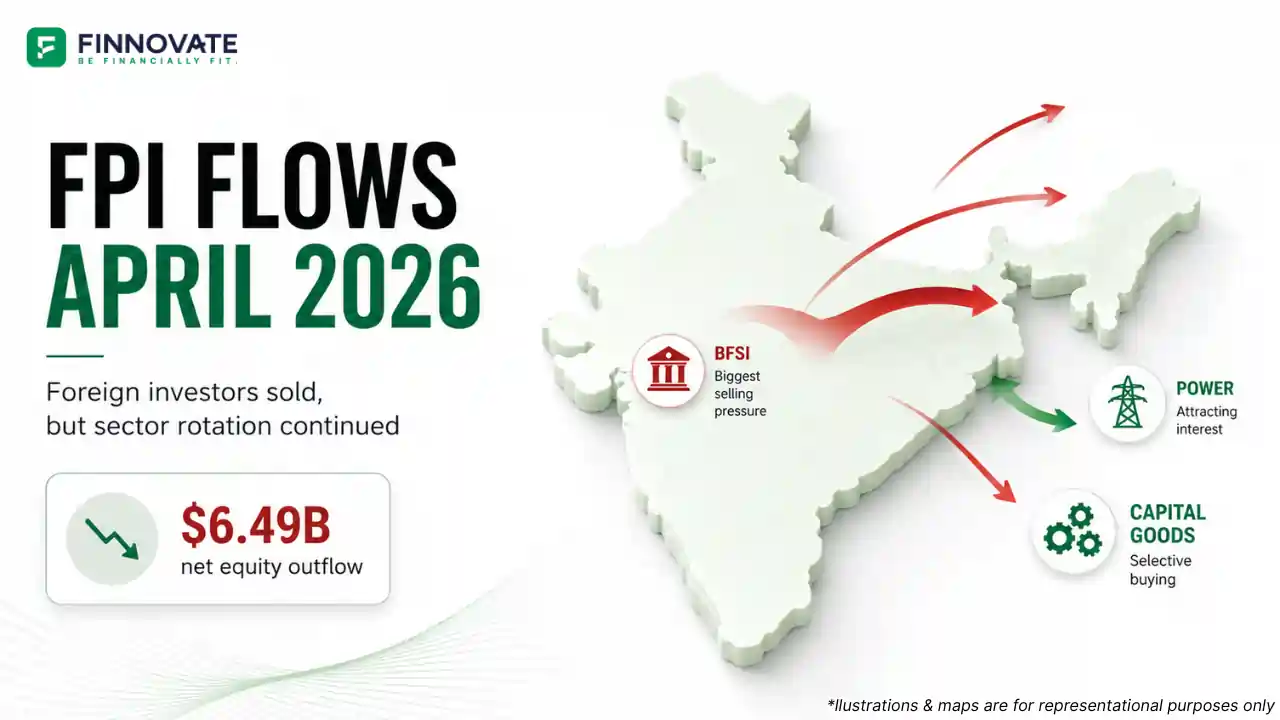
April 2026 brought some relief in the headline number. FPIs sold $6.49 billion worth of Indian equities last month, roughly half the $12.58 billion sold in March. But the direction did not change. April marked the seventh consecutive month of net FPI selling in Indian equities, and the cumulative outflow since the September 2024 peak now stands at $52.36 billion.
The context matters. FPIs were net buyers for most of 2023 and into mid-2024. The September 2024 peak represented the high point of that cycle. What followed was a sustained reallocation away from Indian equities, accelerated in early 2026 by the Middle East conflict, rupee pressure, and a perception that India is underrepresented in the global AI investment story. None of those three drivers resolved in April.
This article covers what the April 2026 NSDL data shows: total outflows, how selling was distributed across the month, which sectors saw the heaviest selling, where FPIs were actually buying, and what the recovery in FPI assets under custody signals.
| Metric | April 2026 | Context |
|---|---|---|
| Net equity selling | $(6.49) billion | Rs 60,847 crore per NSDL data |
| March 2026 equity selling | $(12.58) billion | Record outflow month |
| First fortnight selling | $(5.15) billion | Selling concentrated early in month |
| Second fortnight selling | $(1.34) billion | Moderation in second half |
| FPI equity AUC (April end) | $713 billion | Recovered from $660 billion in March |
| FPI overall AUC (April end) | $787 billion | Includes debt and hybrid instruments |
| Equity AUC vs Sep 2024 peak | 23% below peak | Peak was approximately $927 billion |
| Cumulative net selling since Sep 2024 | $(52.36) billion | Partially offset by DII buying |
The full sector-wise breakdown across all 23 NSDL-tracked sectors is below.
| Sectoral Classification | FPI Flows ($ Million) | Sectoral Classification | FPI Flows ($ Million) |
|---|---|---|---|
| Financial Services | -3,280 | Media, Entertainment | -22 |
| Consumer Services | -827 | Textiles | -10 |
| Healthcare | -737 | Utilities | -1 |
| Oil, Gas and Fuels | -711 | Diversified | +1 |
| Automobile and Components | -583 | Forest Materials | +6 |
| Telecommunication | -467 | Consumer Durables | +7 |
| Information Technology | -445 | Construction | +95 |
| Fast Moving Consumer Goods | -343 | Metals and Mining | +126 |
| Realty | -227 | Others | +166 |
| Construction Materials | -134 | Capital Goods | +455 |
| Services | -101 | Power | +584 |
| Chemicals | -41 | Grand Total | -6,489 |
Three macro factors kept FPI selling elevated in April, even as the pace slowed from March. Each factor operated independently, but their combined effect on FPI sentiment toward India was reinforcing.
The ongoing Iran conflict introduced supply chain constraints raising input cost pressures across Indian manufacturing. Crude oil price uncertainty directly affects India's import bill, current account, and the rupee. FPIs factor currency risk into their return calculations. A depreciating rupee erodes rupee-denominated returns when converted back to dollars or euros, reducing the effective yield on Indian equity holdings. This mechanism explains why oil price spikes and rupee weakness tend to amplify FPI selling in the same window.
The rupee fell in tandem with the crude price spike in the period under review. A weaker rupee adds to FPI return anxiety and creates a negative feedback loop: as FPIs sell equities, they also sell rupees to repatriate proceeds, putting further downward pressure on the currency. This cycle was visible in April, particularly in the first fortnight when selling was most concentrated at $5.15 billion.
A structural concern gaining traction in FPI positioning is India's limited exposure to artificial intelligence infrastructure companies. Global capital is flowing toward AI-intensive economies: Taiwan for chip manufacturing, South Korea for display and memory components, and China for AI application layers. India's listed equity universe does not offer comparable AI infrastructure plays at scale. FPI data since late 2024 shows a directional shift away from India and toward these markets. Whether this reflects a structural reassessment or a temporary perception gap is not yet clear from the data, but the pattern is present.
Of the 23 sectors tracked by NSDL, 15 saw net FPI selling and 8 saw net FPI buying in April 2026. The selling was not evenly distributed. Five sector groupings account for the bulk of the outflows, each driven by a distinct concern.
BFSI dominated FPI selling for the second consecutive month, accounting for over half of all April outflows. Two factors drove this concentration. Financial services stocks are among the most liquid names in Indian markets, making them the natural exit point when FPIs need to reduce India exposure quickly. The sector also carries exposure to any credit quality deterioration that a domestic demand slowdown or inflation shock might cause. FPIs appear to be pricing in a risk premium on Indian financial services at current valuations.
Consumer Services saw net selling of $(827) million and FMCG saw $(343) million, together accounting for $1.17 billion of outflows. The pattern reflects cautiousness on domestic demand. Supply chain disruptions and input cost pressures from the Middle East situation are expected to compress margins in consumer-facing sectors over coming quarters. FPIs appear to have pulled forward their reassessment of this exposure rather than waiting for quarterly results to confirm the concern.
Oil, Gas and Fuels saw $(711) million of selling and Automobile and Components saw $(583) million. Both sectors are directly exposed to crude price uncertainty. Higher crude raises input costs for auto manufacturers and compresses refining margins for oil and gas companies. The combined $1.29 billion of selling reflects a direct read-through from the Middle East conflict to sector earnings risk.
Information Technology saw $(445) million and Healthcare saw $(737) million of net selling. Both sectors are traditional export-oriented plays that typically benefit from a weaker rupee, since their revenues are substantially dollar-denominated. The fact that FPIs are selling despite rupee weakness points to a separate concern: access risk. Tariff uncertainty and trade policy changes in key export markets are raising questions about the medium-term revenue visibility for both sectors.
Realty saw $(227) million and Construction Materials saw $(134) million of outflows. While FPIs are positioning for Middle East reconstruction spending to benefit Indian capital goods and power companies, domestic real estate demand is showing signs of slowing. That divergence between domestic and export-linked capex themes is visible in the April sectoral data.
Net FPI buying in April 2026 was concentrated in two sectors: Power at $584 million and Capital Goods at $455 million. These two sectors together drew $1.04 billion of net FPI inflows, partially offsetting the selling elsewhere.
The investment thesis behind both purchases is linked. The Middle East conflict is expected to generate reconstruction spending once a ceasefire or normalisation occurs. India's power and capital goods companies are seen as potential beneficiaries of that spending pipeline. Domestically, peak summer power demand conditions and El Nino weather patterns are supporting the near-term earnings outlook for the power sector. Ongoing infrastructure investment programmes underpin capital goods order books.
Metals and Mining ($126 million), Others ($166 million), and Construction ($95 million) also recorded net FPI buying, though at smaller scale. The common thread across all the buying sectors is either domestic infrastructure demand or anticipated external capex recovery.
FPI equity assets under custody recovered from $660 billion at the end of March to $713 billion by April end, an 8% recovery in one month. Total FPI AUC including debt instruments recovered to $787 billion.
This recovery deserves careful reading. It was not driven by fresh FPI buying. Net equity flows remained negative at $(6.49) billion through the entire month. The AUC recovery reflects market price appreciation: Indian equity markets recovered ground in April after the steep March selloff. When the value of existing FPI holdings rises due to market price increases, AUC rises even without new inflows.
The equity AUC of $713 billion remains 23% below the September 2024 peak. That gap represents approximately $214 billion of FPI equity wealth that has not returned to Indian markets. DII buying has absorbed much of the selling pressure and kept Indian markets from falling further, but the FPI equity footprint in India remains meaningfully reduced from its high point.
FPI selling does not affect all equity portfolios equally. Sector allocation, large-cap vs mid-cap mix, and time horizon all shape how FPI-driven volatility flows through to your returns. We can walk through your portfolio's FPI exposure in a 30-minute call.
Book a free callMarch 2026 was a record month of FPI selling at $12.58 billion, driven by a cluster of global risk-off events. April saw some stabilisation in global markets and a clear moderation in the second fortnight, where outflows fell to $1.34 billion from $5.15 billion in the first half of the month. The underlying reasons for FPI caution on India did not change in April; the pace moderated but the direction held.
BFSI stocks are among the most liquid and largest-weight names in Indian indices, making them the first exit point when FPIs need to reduce India exposure quickly. Beyond liquidity, the sector carries macro sensitivity to credit quality, interest rate cycles, and domestic demand conditions. In an environment of uncertainty, FPIs tend to reduce BFSI exposure early and in large size.
Not necessarily. The AUC rose from $660 billion to $713 billion because Indian equity prices recovered in April, increasing the market value of existing FPI holdings. Net equity flows remained negative at $(6.49) billion for the month. A genuine return of FPI buying would require a reversal in net flows, not just a market price-driven AUC recovery.
In April 2026, net FPI buying was concentrated in Power ($584 million) and Capital Goods ($455 million), with smaller buying in Metals and Mining, Others, and Construction. These sectors are seen as beneficiaries of domestic infrastructure demand, El Nino peak power conditions, and potential Middle East reconstruction activity. Please consult a SEBI-registered investment adviser before making any investment decisions based on sectoral FPI flows.
Cumulative net FPI selling in Indian equities since the September 2024 peak stands at $52.36 billion per NSDL data. This has been substantially offset by domestic institutional investor buying, which has kept Indian market indices from falling to levels that would directly reflect this quantum of foreign selling.
A resolution in the Middle East could remove one of the three factors currently weighing on FPI sentiment toward India. However, the other two factors, rupee pressure and India's limited AI sector exposure, are structural and would not automatically resolve with a ceasefire. Past FPI flow patterns are not indicative of future flows. Please consult a SEBI-registered investment adviser for guidance on portfolio positioning.
Disclaimer: This article is for general information and educational purposes only. It does not constitute investment advice, a recommendation, or an offer to buy or sell any securities or financial instruments. FPI flow data is sourced from NSDL. Past FPI flow patterns and market behaviour are not indicative of future outcomes. This article is not a substitute for professional financial advice and no investment decision should be based solely on its contents. Please consult a SEBI-registered investment adviser or qualified financial professional before making any investment decision. Equity investments are subject to market risks.
No spam. Only new posts, simple explainers, and practical money checklists for busy professionals.
Finnovate is a SEBI-registered financial planning firm that helps professionals bring structure and purpose to their money. Over 3,500+ families have trusted our disciplined process to plan their goals - safely, surely, and swiftly.
Our team constantly tracks market trends, policy changes, and investment opportunities like the ones featured in this Weekly Capsule - to help you make informed, confident financial decisions.
Learn more about our approach and how we work with you:


No spam. Only new posts, simple explainers, and practical money checklists.
You may also like
Quick commerce runs on dense urban clusters - a model that covers 8% of India's population...

The Fed held rates at 3.50%-3.75% on June 17, 2026. Warsh's first meeting as chair: a 130-...

FPIs sold $6.70 billion from Indian equities in H1 June 2026, reversing May's tapering tre...

Indian online shoppers lose ₹25,000-28,000 crore a year to dark patterns. 88% are affect...
Popular now
Learn how to easily download your NSDL CAS Statement in PDF format with our step-by-step g...
Learn what SIF investment means in India, SEBI rules, Rs 10 lakh minimum investment, avail...
Looking for the best financial freedom books? Here’s a handpicked 2026 reading list with...
Clear guide to mutual fund taxation in India for FY 2025–26 after July 2024 changes: equ...