
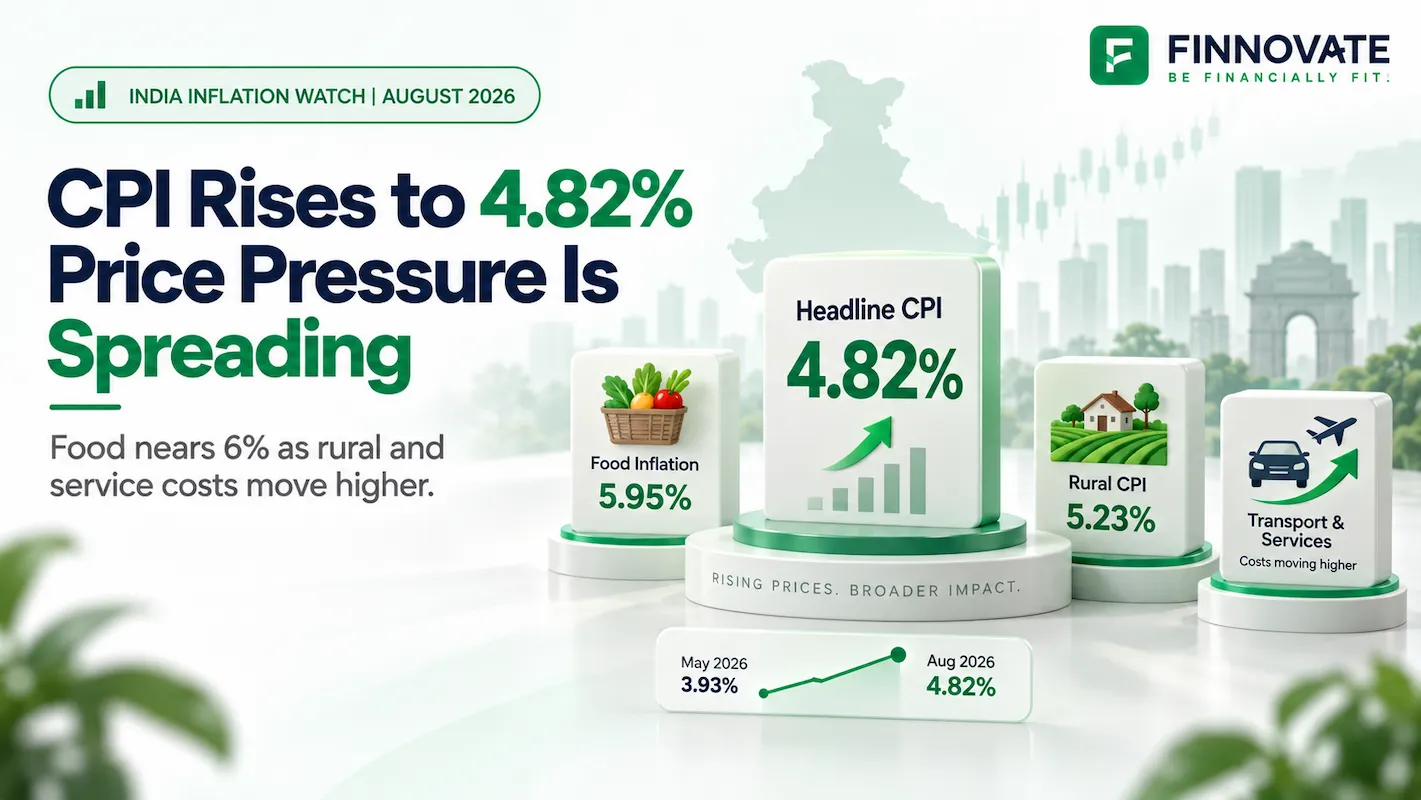
India CPI Inflation August 2026: Food Nears 6% as Rural Inflation Rises
India’s CPI inflation rose to 4.82% in August 2026 as food inflation neared 6% and rural...
21 September 2026

Finnovate’s editorial team researches and creates financial content using trusted sources, regulatory references and inputs from subject experts.
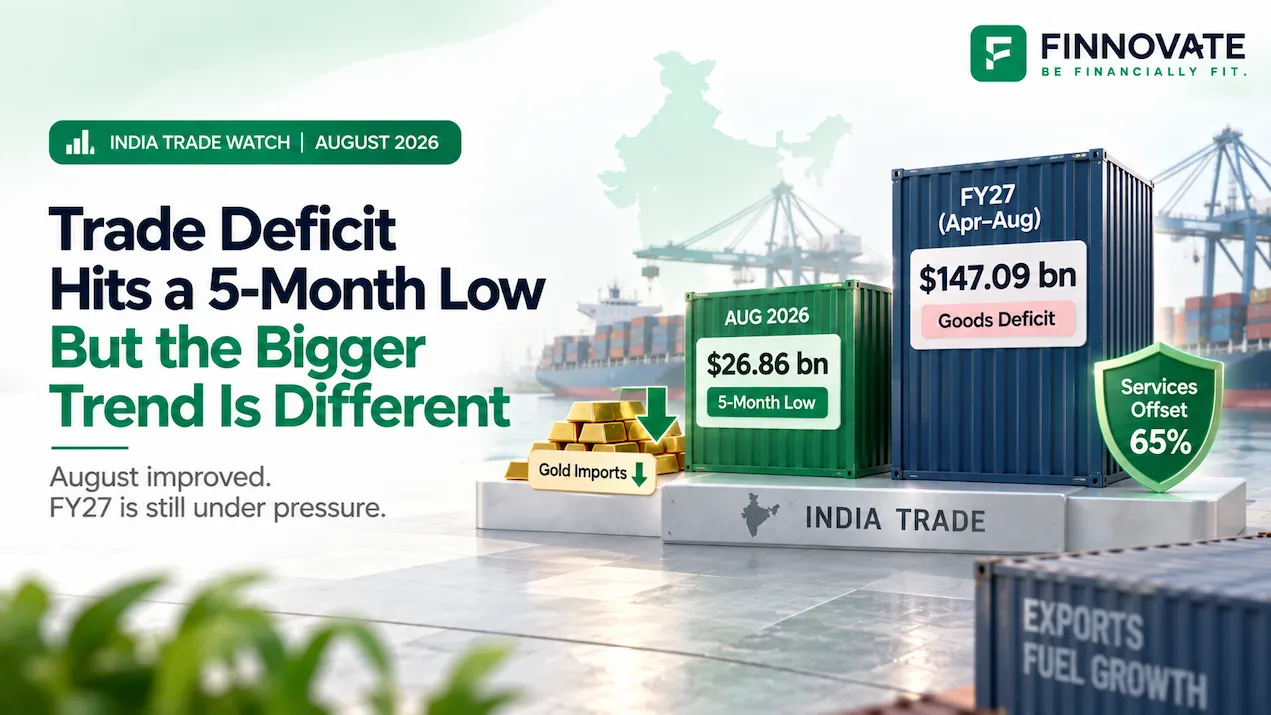
India’s merchandise trade deficit narrowed to $26.86 billion in August 2026, down sharply from about $31.98 billion in July.
That makes August look much better at first glance. Imports fell, gold buying dropped sharply, exports remained strong and the services surplus continued to provide an important cushion.
But the monthly number hides a less comfortable fiscal-year picture.
During the first five months of FY27, India’s merchandise trade deficit reached $147.09 billion, almost 19% higher than the same period last year. And the estimated combined goods-and-services trade deficit widened by more than 37%.
Table of Contents
India exported $43.81 billion of merchandise in August, while importing $70.67 billion. That left a goods deficit of $26.86 billion.
The important point is that two very different comparisons are possible.
| Trade Measure | August 2026 | July 2026 | August 2025 |
|---|---|---|---|
| Merchandise exports | $43.81 bn | $44.24 bn | $34.74 bn |
| Merchandise imports | $70.67 bn | $76.22 bn | $61.96 bn |
| Merchandise deficit | $26.86 bn | $31.98 bn | $27.22 bn |
Versus July, exports were almost flat, declining roughly 1% month-on-month.
Versus August last year, however, exports were up an impressive 26.1%. Merchandise imports were also 14.1% higher year-on-year.
About 16% narrower
Only about 1.3% narrower
That distinction matters because a five-month low sounds much more dramatic than the year-on-year improvement actually was.
Gold imports were one of the biggest reasons August looked better.
They fell to around $2.3 billion, from approximately $4.16 billion in July. That is a decline of roughly 45% month-on-month and almost 58% year-on-year.
But total merchandise imports fell by about:
between July and August.
The decline in gold imports explains roughly:
of that fall.
In other words, gold was important, but it accounted for only about one-third of the total monthly decline in imports.
Lower non-oil, non-gold imports also contributed.
Gold provided relief.
Crude oil did not.
India’s crude-oil import bill rose to approximately $16.69 billion in August, up around 25.8% from a year earlier. The Indian crude basket averaged about $90.19 per barrel during the month.
That makes the phrase “crude imports grew only 25%” misleading.
A 25% increase in one of India’s largest import categories is substantial.
If global crude prices rise, India can spend substantially more dollars even without increasing the number of barrels it imports.
That matters because India is structurally dependent on imported energy. Higher oil prices can therefore affect the trade deficit, the rupee and domestic inflation at the same time.
August’s export growth looks broad when viewed through percentage growth rates.
But a few large sectors explain most of the actual increase in dollars.
Exports increased from $2.93 billion to $5.55 billion, an increase of $2.62 billion and nearly 90% year-on-year.
Exports rose from $4.17 billion to $6.81 billion, adding $2.64 billion, or about 63% year-on-year.
Exports rose from $9.87 billion to $12.32 billion, adding $2.45 billion, or almost 25% year-on-year.
Together, those three categories added approximately:
India’s total merchandise exports increased by about:
year-on-year.
So electronics, petroleum products and engineering goods together explain roughly 85% of the net increase in merchandise exports.
That is the real export story behind August.
Electronic-goods exports rose nearly 90% year-on-year to $5.55 billion.
That supports the broader story of India becoming a larger electronics manufacturing and export base.
But there is an important distinction.
Higher electronics exports do not automatically mean the same amount of domestic value addition has been created.
A product can be assembled in India while still depending heavily on imported chips, displays, components and manufacturing equipment.
So electronics export growth is encouraging, but the next question is whether India can progressively localise more of the value embedded in those exports.
That is the same issue visible in India’s broader manufacturing strategy.
India’s services sector continues to play the role of a powerful counterweight to the merchandise deficit.
For August, the government estimated:
Against a merchandise deficit of $26.86 billion, that means the estimated services surplus offset roughly:
That is a significant cushion.
However, one detail needs to be kept in mind.
The government explicitly states that the August services numbers are estimates, because the latest RBI services data available at the time of the trade release was for July.
This is where the FY27 picture becomes more important than the August headline.
$147.09 billion
$86.71 billion
That means services offset roughly:
of the goods deficit.
During the same period last year:
That implies an offset of around:
So even though August itself produced a strong services cushion, the cumulative FY27 cushion is weaker than it was a year ago.
Because the goods deficit is expanding faster than the services surplus.
| Trade Measure | FY27 Apr-Aug | FY26 Apr-Aug | Change |
|---|---|---|---|
| Merchandise exports | $215.91 bn | $183.21 bn | +17.85% |
| Merchandise imports | $363.00 bn | $307.09 bn | +18.21% |
| Merchandise deficit | $147.09 bn | $123.88 bn | +18.74% |
| Estimated services surplus | $86.71 bn | $79.94 bn | +8.47% |
| Estimated combined deficit | $60.38 bn | $43.94 bn | +37.41% |
Exports are growing strongly.
But imports are growing slightly faster.
More importantly, the goods deficit is widening much faster than the services surplus is growing.
So one relatively good August has not reversed the deterioration visible across the first five months of FY27.
These terms are often used together, but they measure different things.
This compares exports and imports of physical goods. India usually runs a deficit here.
This adds trade in services such as IT, consulting, finance and travel. India’s services surplus offsets a large part of its goods deficit.
This goes further and includes other flows such as investment income and transfers, including remittances.
This includes the current account plus capital and financial flows.
That distinction matters because India can have a current-account deficit while still recording a balance-of-payments surplus.
India’s current-account deficit in July was about $7 billion.
Yet the overall balance of payments recorded a surplus of $20.8 billion, helped by a very large increase in foreign-exchange inflows after measures designed to attract overseas deposits and funding.
This is not contradictory.
It simply means India paid out more than it earned on its current external transactions, but received enough financial inflows to more than finance that gap.
That is why the current account and balance of payments need to be analysed separately.
India’s current-account deficit for the April-June quarter was:
compared with:
a year earlier.
The widening was driven partly by a larger merchandise deficit, which rose to $86.1 billion from $68.9 billion.
So the external-account pressure is real.
But the size still matters.
ICRA has estimated that the full-year FY27 current-account deficit could end up around 0.9% of GDP. That would be higher, but it would still be far from the kind of current-account imbalance India has experienced during more stressed periods.
India has attracted very large foreign-currency inflows this year through FCNR(B) deposits and other overseas funding channels.
Those inflows have strengthened foreign-exchange reserves and increased the RBI’s ability to manage currency volatility.
If India imports more goods than it exports, that gap still exists.
Capital flows determine how comfortably that gap can be financed.
This is why a country can simultaneously have:
The rupee ended last week around ₹95.87 per dollar, with elevated oil prices and importer demand continuing to create pressure.
The link with trade is straightforward.
India needs dollars to pay for imports.
When the oil-import bill rises, demand for dollars can increase.
If export earnings and capital inflows are not strong enough to compensate, the rupee can face additional pressure.
The RBI can intervene using its reserves, and strong financial inflows can help.
But structurally, a wider goods deficit still creates more demand for foreign currency.
The external-account story does not stop at the currency.
India’s wholesale inflation reached 9.92% in August, with fuel and power prices up 22.93% year-on-year.
Higher crude prices can therefore affect India through several channels at once:
This is why crude remains one of the most important variables in India’s external-sector outlook.
The next few months will show whether August was the start of a genuine improvement or simply a temporary better month.
The relationship between these variables matters more than any single monthly number.
August was genuinely better.
The merchandise deficit fell to a five-month low, exports remained very strong year-on-year and services offset a large part of the goods gap.
But the cumulative picture remains less comfortable.
So the right conclusion is not that India’s external problem has disappeared.
It is that August provided some relief inside a fiscal year that still carries more external pressure than FY26.
India recorded a merchandise trade deficit of $26.86 billion in August 2026, compared with about $31.98 billion in July.
The biggest reason was lower imports, especially a sharp drop in gold imports. Total merchandise imports fell from $76.22 billion in July to $70.67 billion in August. Lower non-oil, non-gold imports also contributed.
No. Exports were almost flat compared with July, but rose 26.1% year-on-year to $43.81 billion, making August a strong export month historically.
Electronic goods, petroleum products and engineering goods were the biggest large-category contributors. Together they accounted for roughly 85% of the net year-on-year increase in merchandise exports.
Based on the government’s estimated August services data, the services surplus was $17.45 billion, offsetting roughly 65% of the $26.86 billion merchandise deficit.
The Q1 FY27 current-account deficit was 0.5% of GDP, only modestly higher than 0.4% a year earlier. Pressure has increased, but the current level is still relatively contained.
A wider deficit can increase demand for foreign currency, put pressure on the rupee and make India more sensitive to oil prices and capital flows. It can also contribute to imported inflation when the cost of key imports rises.
Disclaimer: This article is for educational and informational purposes only. Trade, currency, inflation and current-account data can change as official estimates are revised. Nothing in this article should be treated as investment advice or as a forecast of future market or currency movements.
No spam. Only new posts, simple explainers, and practical money checklists for busy professionals.
Finnovate is a SEBI-registered financial planning firm that helps professionals bring structure and purpose to their money. Over 3,500+ families have trusted our disciplined process to plan their goals - safely, surely, and swiftly.
Our team constantly tracks market trends, policy changes, and investment opportunities like the ones featured in this Weekly Capsule - to help you make informed, confident financial decisions.
Learn more about our approach and how we work with you:
No comments yet. Start the conversation. What would you add?
No spam. Only new posts, simple explainers, and practical money checklists.
You may also like
India’s CPI inflation rose to 4.82% in August 2026 as food inflation neared 6% and rural...

Passive funds saw ₹10,876 crore of net inflows in August 2026. See which categories led,...

India’s semiconductor push is expanding beyond fabs. See how Applied Materials, Tata, Ne...

The US Fed raised rates by 25 bps to 3.75%-4.00% in September 2026. See why it hiked, what...
Popular now

Learn how to easily download your NSDL CAS Statement in PDF format with our step-by-step g...

Looking for the best financial freedom books? Here’s a handpicked 2026 reading list with...

Learn what SIF investment means in India, SEBI rules, Rs 10 lakh minimum investment, avail...

Clear guide to mutual fund taxation in India for FY 2025–26 after July 2024 changes: equ...