
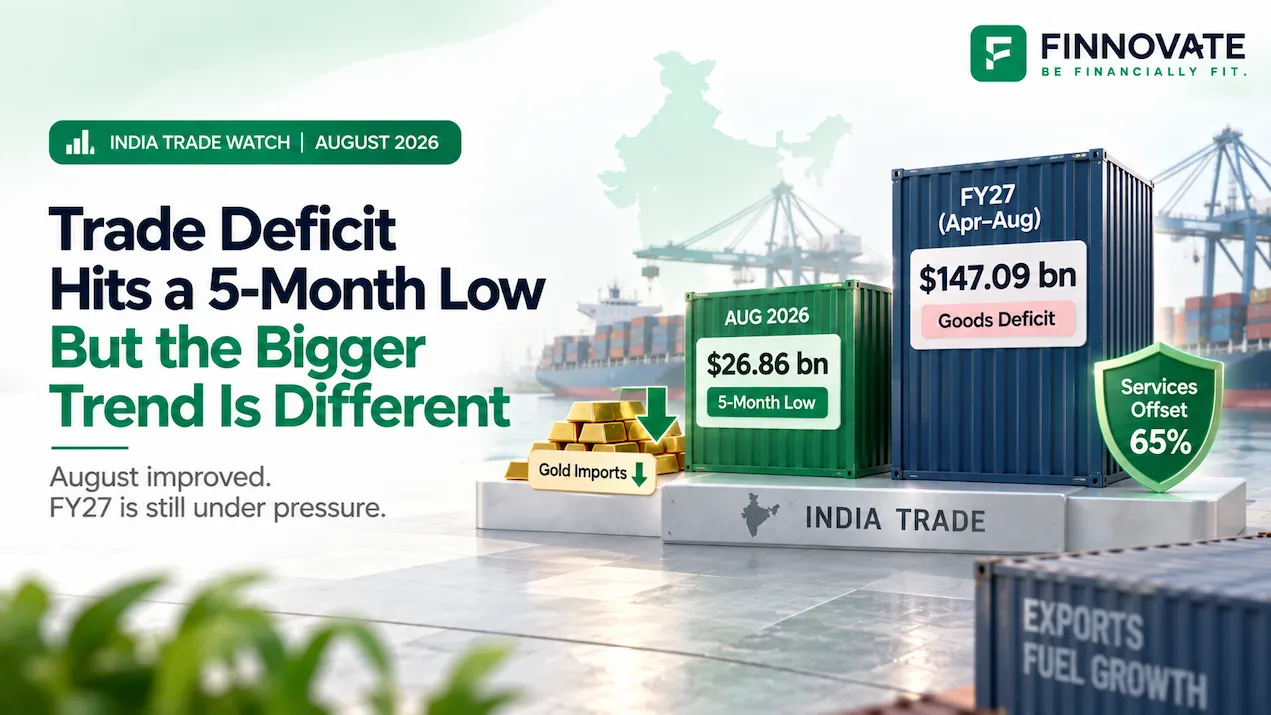
India Trade Deficit August 2026: Why the 5-Month Low Matters
India’s trade deficit narrowed to $26.86 billion in August 2026. See what drove the impr...
21 September 2026

Finnovate’s editorial team researches and creates financial content using trusted sources, regulatory references and inputs from subject experts.
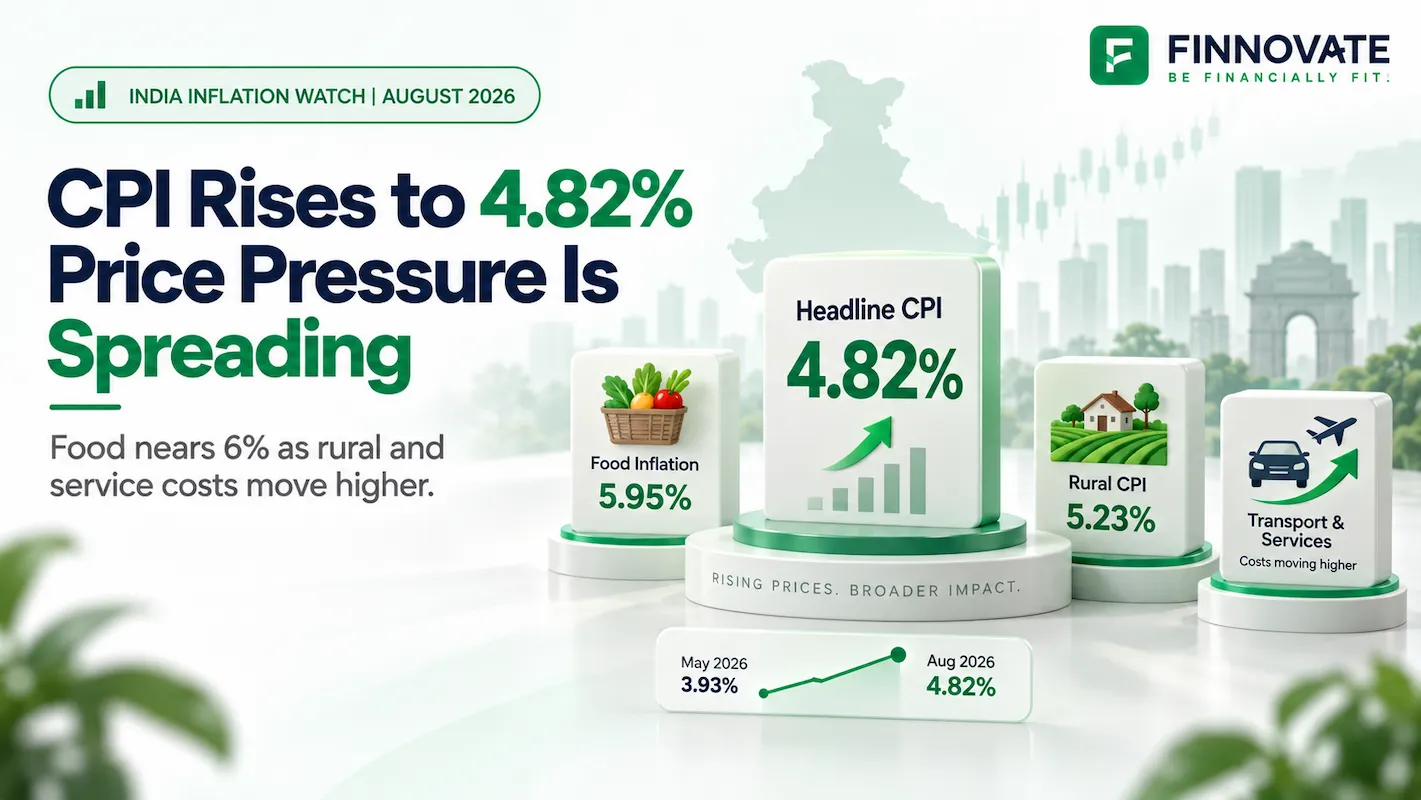
India's retail inflation rose to 4.82% in August 2026, up from 4.45% in July.
On its own, 4.82% does not look alarming. It remains below the RBI's 6% upper tolerance level.
But that is not the most important part of the August inflation data.
India's headline inflation has now increased from 3.93% in May to 4.82% in August. Food inflation has climbed even faster, from 4.78% to 5.95% over the same period. Rural inflation is running above urban inflation, restaurant and accommodation prices are rising at more than 8%, transport inflation is moving higher, and core inflation has also crossed 4%.
That changes the question from "Is inflation high?" to "How persistent could this increase become?"
Table of Contents
The most useful way to read August's CPI number is not in isolation.
Look at the progression:
| Inflation Measure | May 2026 | June 2026 | July 2026 | August 2026 |
|---|---|---|---|---|
| Headline CPI | 3.93% | 4.38% | 4.45% | 4.82% |
| Food inflation | 4.78% | 5.32% | 5.52% | 5.95% |
Between May and August:
Food inflation increased by an even larger:
The movement has therefore been gradual rather than a one-month spike.
June took headline inflation above the RBI's 4% medium-term target. July moved slightly higher. August accelerated further.
This is different from a situation where one temporary vegetable-price shock pushes inflation higher for a month and then disappears.
It does not prove that inflation will continue rising.
But it does make the direction of travel harder to ignore.
Food inflation reached 5.95% in August, compared with 5.52% in July and 5.32% in June.
Within the broader CPI division, food and beverages inflation also rose steadily:
| Month | Food & Beverages Inflation |
|---|---|
| June 2026 | 5.05% |
| July 2026 | 5.24% |
| August 2026 | 5.66% |
The distinction between food inflation and food-and-beverages inflation comes from how the CPI categories are constructed, but both measures show the same direction.
Food price pressure has been increasing.
That matters particularly in India because food represents a meaningful share of household consumption, and changes in everyday food prices are felt more frequently than changes in many other parts of the CPI basket.
It also helps explain why the inflation experience can feel more severe to households than the 4.82% headline figure suggests.
A 5.95% food inflation number does not mean food prices are moving uniformly.
August actually produced large increases and large declines at the same time.
Among the items with the highest year-on-year inflation were:
| Item | August 2026 Inflation |
|---|---|
| Ginger | 73.82% |
| Onion | 48.27% |
| Garlic | 43.60% |
But elsewhere:
| Item | August 2026 Inflation |
|---|---|
| Tomato | -31.09% |
| Potato | -13.14% |
| Lady's finger | -5.41% |
So the food story is more complicated than saying vegetables became expensive.
Onions, garlic and ginger were exerting upward pressure, while tomatoes and potatoes were doing the opposite.
This is why food inflation can also change quickly.
Many agricultural prices are affected by weather, supply conditions, crop arrivals, storage, imports and government intervention.
A sharp increase in one month does not automatically continue at the same pace.
Another trend deserves more attention.
Rural inflation has remained above urban inflation and the gap has gradually widened.
| Month | Rural CPI | Urban CPI | Rural-Urban Gap |
|---|---|---|---|
| June 2026 | 4.74% | 3.93% | 0.81 percentage points |
| July 2026 | 4.84% | 3.96% | 0.88 percentage points |
| August 2026 | 5.23% | 4.31% | 0.92 percentage points |
Rural food inflation in August was also higher at 6.13%, compared with 5.64% in urban India.
The gap is not enormous in isolation.
But the direction is notable.
Rural households are seeing higher inflation across several areas including food, clothing, household fuels and transport.
And because spending patterns differ between rural and urban households, the same national CPI number does not describe everybody's actual cost-of-living experience equally.
Food remains important, but August's data show that the inflation story is becoming wider.
Consider how some major CPI divisions have changed since June:
| CPI Division | June 2026 | July 2026 | August 2026 |
|---|---|---|---|
| Food & beverages | 5.05% | 5.24% | 5.66% |
| Clothing & footwear | 3.23% | 3.38% | 3.56% |
| Housing, water, power & gas | 1.99% | 2.16% | 2.61% |
| Furnishings & household equipment | 2.19% | 2.40% | 2.68% |
| Transport | 4.31% | 4.43% | 4.60% |
| Education services | 3.34% | 3.64% | 3.73% |
| Restaurants & accommodation | 6.91% | 7.72% | 8.38% |
Not every category is accelerating sharply.
Health inflation, for example, remained relatively low at 1.34%.
But the pattern is still important because several everyday spending categories have been moving higher together. August's official data put transport inflation at 4.60%, restaurants and accommodation at 8.38%, and housing, water, electricity, gas and other fuels at 2.61%.
This is one reason the inflation debate is becoming more complicated than a pure food-price story.
Two categories stand out.
First, restaurants and accommodation services.
Inflation in this category has moved from:
Within the category, food and beverage serving services were also running above 8%.
This matters because eating out combines several inflation channels at once.
Restaurants pay for food ingredients, cooking fuel, transportation, rent, electricity, wages and other operating expenses. When several of those inputs become more expensive, some of that cost can eventually appear in menu prices.
Transport presents a similar story.
Overall transport inflation stood at 4.60%, but some subcategories were considerably higher.
The cost of operating personal transport equipment rose 7.40%, while transport services for goods recorded inflation of 14.64%.
That second number matters beyond transport itself.
Goods need to move from farms, factories and warehouses to stores.
Higher freight costs can therefore become one of the channels through which energy costs eventually reach other consumer prices.
One of the most striking numbers in the August CPI release had nothing to do with food.
Silver jewellery inflation stood at:
Gold, diamond and platinum jewellery recorded:
This helped keep inflation in the broader personal care, social protection and miscellaneous goods and services division extremely high at 15.17%.
But these numbers need context.
Silver jewellery has a weight of only 0.3127% in the CPI basket, while gold, diamond and platinum jewellery carries a weight of 0.6230%.
So a product can have inflation above 100% without having anything close to a 100% effect on the overall CPI.
That distinction becomes particularly important when analysing core inflation.
Core inflation, which excludes volatile food and fuel components and is commonly used as a gauge of underlying price pressure, increased from around 3.86% in July to 4.2% in August, according to Reuters.
At first glance, that supports the argument that inflationary pressure is extending beyond food and fuel.
But core inflation also needs to be interpreted carefully.
Removing food and fuel does not mean every remaining component of the index is stable. August also saw exceptionally high inflation in precious-metal jewellery, with silver jewellery up 107.11% year-on-year and gold, diamond and platinum jewellery up 35.53%.
Those categories have relatively small weights in the overall CPI basket, but they are still part of the broader non-food, non-fuel price picture.
The more important question for the RBI will be whether price increases continue spreading across services and other everyday spending categories over the coming months.
Consumer inflation is not the only price measure running high.
India's Wholesale Price Index inflation stood at 9.92% in August, compared with 9.78% in July.
Within WPI:
| Category | August 2026 Inflation |
|---|---|
| Primary articles | 7.76% |
| Fuel & power | 22.93% |
| Manufactured products | 8.37% |
Mineral-oil inflation was even higher at 38.48%.
WPI and CPI measure different things.
A rise in wholesale prices does not pass automatically or immediately into consumer prices. Businesses can absorb some higher costs through margins, change suppliers, improve efficiency or pass costs through only gradually.
But sustained increases in fuel, raw materials and manufactured-product prices create another source of pressure that deserves monitoring.
This becomes more relevant if those higher costs persist for several months.
The outlook for food inflation depends partly on what happens outside financial markets.
Rainfall has been weak.
By September 19, cumulative nationwide monsoon rainfall was around 15% below normal, while a substantial share of the country remained rain deficient.
Reservoir storage has improved with recent rainfall, but the national picture has remained below normal.
Central Water Commission data cited for September 10 showed storage in 178 monitored reservoirs at 70.66% of capacity, around 6.9% below the normal level and 20.1% lower than a year earlier.
This matters because agricultural inflation is not only about the current Kharif crop.
Water availability also affects irrigation for the Rabi season.
However, it would be too strong to conclude today that weak reservoirs automatically mean a poor Rabi crop or significantly higher food inflation.
Rainfall can improve. Reservoirs can refill. Government buffer stocks can be released. Imports can change domestic supply. Individual crop conditions can differ significantly.
If food is one important domestic risk, crude oil is the major external one.
India imports most of the crude oil it consumes.
That creates several possible channels from higher global oil prices into the Indian economy.
Higher crude can raise the import bill. It can put pressure on the rupee. It can increase fuel and freight costs. And over time it can raise production and transportation expenses across businesses.
Around the release of the August inflation data, Brent crude was trading close to $108 per barrel, with global supply disruptions keeping energy markets elevated.
The connection with CPI is not always immediate.
Retail petrol and diesel prices do not necessarily change every time international crude prices move.
But if crude remains high for long enough, the second-round effects become more relevant.
This is one reason transport inflation deserves as much attention as the headline CPI number itself.
Not automatically.
India's inflation target remains 4%, with a tolerance band of 2% to 6%, for the five-year period running from April 2026 to March 2031.
So 4.82% is:
The RBI's 4% inflation target.
The 6% upper tolerance level.
Those are two different things.
The RBI's policy repo rate currently stands at 5.25%. At its August meeting, the Monetary Policy Committee kept the rate unchanged.
August's CPI reading strengthens the case for the RBI to watch inflation more closely, particularly because core inflation has moved higher and food, transport and services are all contributing.
But monetary policy does not react mechanically to one number.
The RBI will be looking at whether inflation persists, whether it spreads further, what happens to crude oil and the rupee, how food prices develop and how growth is holding up.
That makes the next policy decision more finely balanced.
It does not make a rate hike predetermined.
Another development has changed since the RBI's August meeting.
On September 16, the US Federal Reserve raised its target range by 25 basis points to 3.75%-4.00%.
It is tempting to turn this into a simple conclusion:
That is not how the relationship works.
The RBI sets policy primarily according to India's inflation and growth conditions.
But US rates still matter.
Higher American interest rates can influence global bond yields, the dollar, foreign capital flows and emerging-market currencies.
For India, that means the Fed decision becomes another factor in the background, particularly at a time when the RBI is already dealing with domestic inflation and expensive energy.
The most direct effect of inflation is not on a chart.
It is on purchasing power.
Suppose a household needs ₹1 lakh per month today.
If expenses rise at an average 5% a year, maintaining approximately the same spending power would require:
| Time | Monthly Expense at 5% Inflation |
|---|---|
| Today | ₹1.00 lakh |
| After 5 years | ₹1.28 lakh |
| After 10 years | ₹1.63 lakh |
| After 15 years | ₹2.08 lakh |
| After 20 years | ₹2.65 lakh |
These are illustrations, not a forecast that inflation will remain at 5%.
The point is that even seemingly moderate inflation becomes significant when compounded for long periods.
This matters particularly for retirement, children's education and other goals that may be 10, 15 or 20 years away.
Finnovate's Inflation Calculator can help estimate how the future cost of an expense changes under different inflation assumptions.
For retirement planning specifically, the effect becomes even larger because inflation continues after retirement too.
August has made five indicators more important.
The first is food inflation. At 5.95%, it remains the largest near-term swing factor, particularly with rainfall and agricultural conditions still uncertain.
The second is core inflation. Core CPI has crossed 4%. If price pressure continues spreading across services and other non-food, non-fuel categories, the case that inflation is becoming more widespread would strengthen.
The third is crude oil and transport costs. Sustained high energy prices can eventually affect freight, manufacturing, the rupee and household expenses.
The fourth is rural inflation. The rural-urban gap has increased from around 81 basis points in June to 92 basis points in August.
And the fifth is RBI policy. The repo rate has remained at 5.25%, but the combination of higher CPI, a Fed rate hike and elevated energy prices has made the inflation-growth trade-off more difficult than it looked at the August meeting.
The September CPI release will provide the next major test of whether August was another step higher or the beginning of some stabilisation. MoSPI has scheduled the September CPI release for October 12, 2026, or the next working day if required.
India's August CPI number does not point to an inflation crisis.
Headline inflation at 4.82% remains inside the RBI's 2%-6% tolerance band.
But that should not distract from what has changed beneath the headline.
Inflation has risen from 3.93% in May to 4.82% in August.
Food inflation is approaching 6%.
Rural inflation is now 92 basis points above urban inflation.
Restaurants and accommodation inflation has moved above 8%.
Transport costs are rising.
Core inflation has crossed 4%.
Wholesale fuel and manufacturing costs also remain elevated.
At the same time, below-normal rainfall, weaker reservoir storage and expensive crude create risks that could keep some of these pressures alive.
It is whether food, fuel and other price pressures begin to reinforce each other strongly enough to make inflation more persistent.
That is the distinction the RBI will have to watch.
And for households, it is another reminder that inflation does not need to reach extreme levels to materially change the future cost of long-term financial goals.
India's headline Consumer Price Index inflation was 4.82% year-on-year in August 2026, compared with 4.45% in July. The August figure is provisional.
Consumer Food Price Index inflation stood at 5.95%, compared with 5.52% in July. Rural food inflation was 6.13%, while urban food inflation was 5.64%.
Higher food prices were an important contributor, while inflation also increased across categories including transport, housing, restaurants and accommodation. Precious-metal prices remained another significant source of inflation in parts of the CPI basket.
Among the items highlighted by MoSPI, ginger recorded inflation of 73.82%, onions 48.27% and garlic 43.60%. In contrast, tomato prices were 31.09% lower year-on-year and potatoes were down 13.14%.
Yes. Rural inflation was 5.23% in August, compared with 4.31% in urban India, a difference of 92 basis points.
No. India's inflation target is 4%, with a tolerance range of 2% to 6%. August inflation was above the 4% target but remained inside the permitted band.
No. August's data increase the importance of inflation in the RBI's policy decision, but the MPC also considers growth, future inflation, crude oil, the rupee, liquidity and other economic conditions. The current repo rate is 5.25%.
Inflation increases the future cost of the same lifestyle or financial goal. At 5% annual inflation, an expense costing ₹1 lakh per month today would cost about ₹1.63 lakh after 10 years and ₹2.65 lakh after 20 years.
Disclaimer: This article is for educational and informational purposes only. Inflation, commodity prices and monetary-policy conditions can change as new data become available. References to interest rates, inflation and market conditions should not be treated as investment advice or as predictions of future RBI policy.
No spam. Only new posts, simple explainers, and practical money checklists for busy professionals.
Finnovate is a SEBI-registered financial planning firm that helps professionals bring structure and purpose to their money. Over 3,500+ families have trusted our disciplined process to plan their goals - safely, surely, and swiftly.
Our team constantly tracks market trends, policy changes, and investment opportunities like the ones featured in this Weekly Capsule - to help you make informed, confident financial decisions.
Learn more about our approach and how we work with you:
No comments yet. Start the conversation. What would you add?
No spam. Only new posts, simple explainers, and practical money checklists.
You may also like
India’s trade deficit narrowed to $26.86 billion in August 2026. See what drove the impr...

Passive funds saw ₹10,876 crore of net inflows in August 2026. See which categories led,...

India’s semiconductor push is expanding beyond fabs. See how Applied Materials, Tata, Ne...
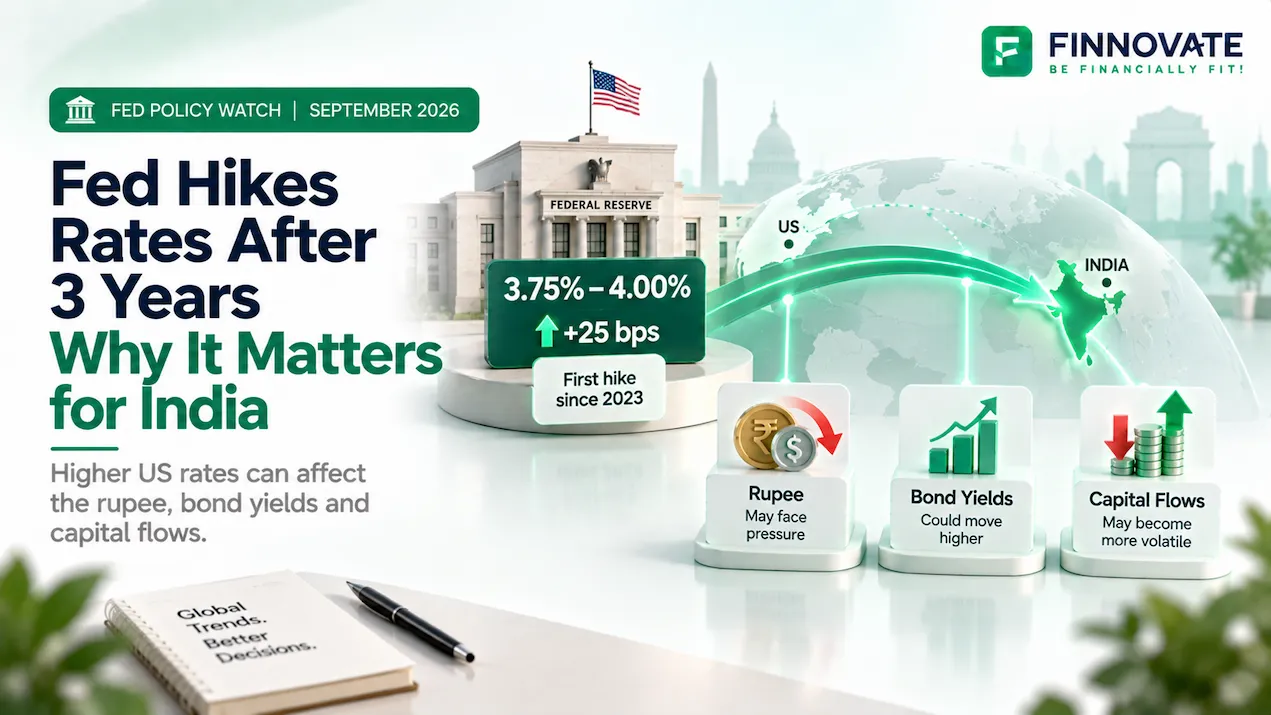
The US Fed raised rates by 25 bps to 3.75%-4.00% in September 2026. See why it hiked, what...
Popular now

Learn how to easily download your NSDL CAS Statement in PDF format with our step-by-step g...

Looking for the best financial freedom books? Here’s a handpicked 2026 reading list with...

Learn what SIF investment means in India, SEBI rules, Rs 10 lakh minimum investment, avail...

Clear guide to mutual fund taxation in India for FY 2025–26 after July 2024 changes: equ...