
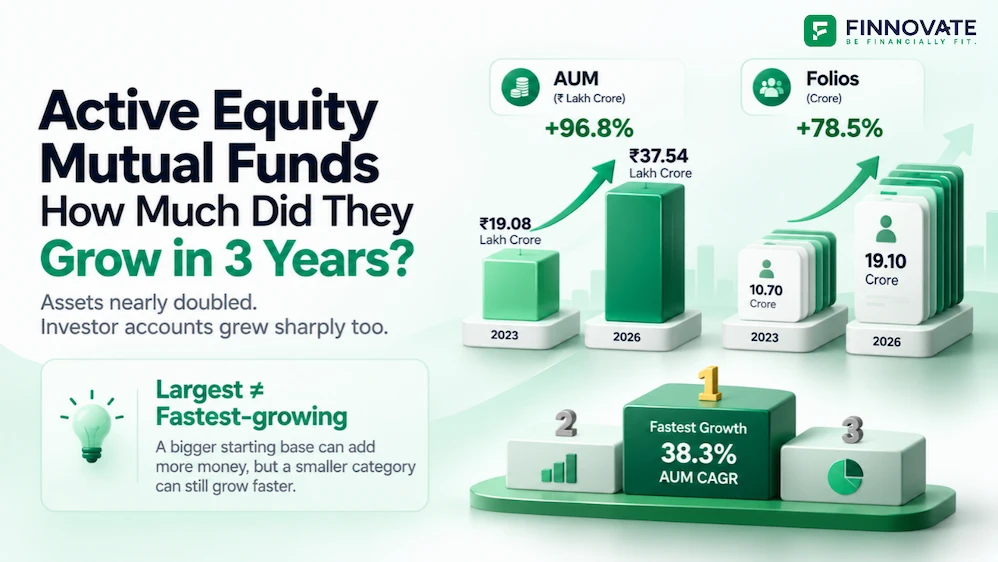
Active Equity Fund Growth 2023–2026: AUM & Folio Rankings
Compare active equity mutual fund growth from September 2023 to September 2026, with categ...
21 October 2026

For most of its post-Independence history, the Indian household's financial instinct was straightforward: earn, save in a bank deposit or post office scheme, and repeat. Equity was for traders. Mutual funds were for the well-connected. The fixed deposit was the bedrock.
That is changing. Between FY2012 and FY2025, the share of equities and mutual funds in annual household financial savings rose from approximately 2 percent to 15.2 percent, according to the Economic Survey 2025-26. Over a shorter period, RBI-linked data shows the share of bank deposits in household financial savings declined from 40.9 percent in FY2021 to 35.2 percent in FY2025.
This appears to be more structural than short-term cyclical, as the shift has held across rate hikes, market corrections, a pandemic, and geopolitical disruption. This article explains what is driving the rotation, who it is reaching and what it means for investors in their 30s and 40s.
One way to see this shift is to compare household flows into deposits with flows into equities and mutual funds. Based on market analysis of RBI Bulletin data, in FY2025, for every Rs 100 of savings that Indian households placed in bank deposits, Rs 45.2 went into mutual funds and equities. In FY2024, that figure was Rs 21.2.
| Metric | Earlier Level | Latest Level |
|---|---|---|
| Equity and MF share of household financial savings | ~2% in FY2012 | 15.2% in FY2025 |
| Bank deposit share of household financial savings | 40.9% in FY2021 | 35.2% in FY2025 |
| Equity + MF flows compared with bank deposit flows | Rs 21.2 per Rs 100 of bank deposits in FY2024 | Rs 45.2 per Rs 100 of bank deposits in FY2025 |
| Household bank deposit flows in FY2025 | Down 8.97% to Rs 12.54 lakh crore, as per market analysis based on RBI Bulletin data | |
| Metric | Figure |
|---|---|
| MF inflows change in FY2025 | +95% year-on-year |
| Direct equity investment change in FY2025 | +153% year-on-year |
| Total MF AUM, December 2025 | Rs 80.2 lakh crore |
| Total MF AUM, April 2026 | Rs 81.92 lakh crore |
| Demat accounts, December 2025 | 21.6 crore+ |
| Demat accounts, 2019 | 3.6 crore |
| Metric | Figure |
|---|---|
| Total MF industry AUM, March 2025 | Rs 65.7 lakh crore |
| Total MF industry AUM, December 2025 | Rs 80.2 lakh crore |
| Open-ended equity scheme AUM, December 2025 | Rs 35.7 lakh crore, around 45% of total |
| Equity folios, March 2025 | 16.4 crore |
| Equity folios, December 2025 | 17.8 crore |
| Total MF folios, December 2025 | 26.1 crore+ |
Alongside this, domestic institutional participation in Indian equities has strengthened in recent years, while foreign portfolio investor ownership has reduced from earlier peaks. This reflects the growing role of domestic savings in Indian equity markets.
The shift from deposits to market-linked instruments does not have a single cause. Four structural forces have compounded over the past decade to produce it.
The RBI cut the repo rate by 125 basis points through 2025, bringing it to 5.25 percent by year-end before holding it there in early 2026. Banks passed on the cuts, repeatedly lowering fixed deposit rates. With CPI inflation running between 4 and 6 percent through much of this period, the real return on a typical one-year FD narrowed significantly.
A 6 percent FD yielding around 1 percent real return before tax in a 5 percent inflation environment is no longer a strong wealth-building instrument. This arithmetic pushed a segment of savers to seek market-linked alternatives for at least a portion of their capital.
Ten years ago, investing in a mutual fund required paperwork, a distributor, and often a branch visit. Today it takes minutes on a mobile application, with KYC completed digitally and SIP mandates set through digital payment systems.
The number of demat accounts grew from 3.6 crore in 2019 to over 21.6 crore by December 2025, a nearly six-fold increase in six years. SEBI's simplified KYC norms, T+1 settlement, and fintech platforms contributed to this expansion, bringing the market within reach of first-generation investors in Tier 2 and Tier 3 cities along with urban salaried professionals.
The systematic investment plan has functioned as a behavioural bridge between the discipline of a recurring deposit and the return profile of equity. Monthly SIP inflows crossed Rs 31,000 crore in early 2026, with the structural trajectory intact even through months of market volatility.
For many households, SIPs became the first equity exposure. Continued participation through down markets showed that equity investing could be made more disciplined through a monthly investing habit. The active vs passive portfolio management framework is relevant context for investors deciding how to structure that equity exposure once participation is established.
The new income tax regime became the default for individual taxpayers from FY2023-24 (AY2024-25) under the Finance Act 2023, and was formalised further under the Income Tax Act 2025 effective April 2026. It offers lower tax rates in exchange for forgoing most deductions.
Section 80C, which had long driven flows into PPF, ELSS, NSC, and life insurance, is not available under the new regime. As more salaried individuals opt for the new regime, the captive tax-driven demand for traditional savings instruments has softened. The result has been a quiet shift of discretionary capital toward instruments chosen on financial merit rather than tax optimisation alone. The mutual fund taxation guide for FY2025-26 covers the relevant tax treatment of equity and debt fund gains.
The aggregate data tells a compelling story of financialisation. The disaggregated picture is more nuanced, and important to understand before drawing conclusions about the breadth of the trend.
| Who is driving the shift | Who is not yet |
|---|---|
| Urban salaried households | Rural and semi-urban India |
| Upper-middle-income professionals | Lower-income households |
| Active demat account holders | Dormant accounts and IPO-only participants |
| Domestic institutional participation | Households still concentrated in gold, real estate, deposits, and physical assets |
The financialisation trend is real, but it is not yet broad-based. It is a structural change in the saving habits of urban India's professional class, and that class is the core of the audience now actively navigating this transition. The aggregate AUM number is impressive. The social base behind it is narrower than it appears.
The savings rotation data, taken together with the compounding data from the Economic Survey, points to a set of observations relevant for investors currently in the 30 to 45 age bracket.
A household that began directing even 10 percent of its monthly savings toward equity-linked instruments in 2015 has had a full decade of compounding. A household starting at a higher allocation percentage today but at age 42 instead of 32 faces a mathematically different outcome.
The Economic Survey's estimate of Rs 53 lakh crore in household equity wealth growth between 2020 and 2025 reflects this pattern. Much of the gain accrued to those who were already in the market before the acceleration began. For those who have held the bulk of long-term savings in FDs through this period, the question is not simply switching categories. It is about pace, risk, and positioning.
Fixed deposits retain a legitimate role in a diversified financial plan as a liquid, low-risk instrument for short-term goals, emergency reserves, and capital earmarked for use within one to three years.
What has changed is the case for parking long-term wealth-building capital exclusively in fixed-income instruments. AMFI data shows the mutual fund industry's AUM grew from Rs 14.22 lakh crore in April 2016 to Rs 81.92 lakh crore in April 2026, an approximately six-fold increase over ten years. The opportunity cost of keeping long-horizon wealth entirely in fixed-income instruments has become more visible against this backdrop.
The better approach is not FD versus mutual fund. The better approach is matching the right product to the right goal and time period.
A 35-year-old professional keeping all long-term savings in FDs may feel safe in the short run. But if the goal is retirement or a child's education 10 to 15 years away, the bigger risk may be low real growth after tax and inflation.
That does not mean moving everything to equity. It means separating emergency money, short-term goals, and long-term wealth-building money.
The data on SIP inflows, demat account growth, and AUM expansion collectively describe more than a category preference shift. They describe a cultural recalibration in how the salaried urban household thinks about its financial surplus. Saving implies preservation. Investing implies deployment for growth.
For households in their 30s, the shift points toward a layered approach by goal horizon:
| Goal Horizon | Possible Role in Portfolio |
|---|---|
| 0 to 2 years | Emergency fund, short-term FDs, liquid instruments |
| 2 to 5 years | Hybrid funds or short-duration debt, depending on risk profile |
| 5 years and above | Equity-linked instruments with long-term compounding potential |
The shift from 2 percent to 15.2 percent in equities and mutual funds' share of household financial savings is not just a market trend. It shows a deeper change in how urban India is managing its surplus money.
FDs still have a role. But for long-term wealth creation, investors now need to think beyond one default product. The right mix depends on goals, time horizon, liquidity needs, tax position, and risk capacity.
For investors in their 30s and 40s evaluating their current portfolio mix, this macro shift provides the backdrop. A SEBI-registered financial adviser can help translate the macro picture into a plan calibrated to individual circumstances.
The shift has been driven by a combination of falling fixed deposit rates reducing real returns, digital platforms making mutual fund investing significantly more accessible, and the growth of SIPs normalising regular equity participation. RBI-linked and Economic Survey data show bank deposits' share of household financial savings fell from 40.9 percent in FY2021 to 35.2 percent in FY2025, while the combined equity and mutual fund share rose to 15.2 percent by FY2025.
No. Fixed deposits continue to serve a specific function in a financial plan: providing liquidity, capital safety, and predictable returns for short-term goals and emergency reserves. What the data highlights is the growing recognition that long-term wealth-building capital has historically shown a different return profile when deployed in equity-linked instruments over longer time horizons. Past performance of any instrument is not indicative of future returns.
Research analysis indicates the shift is concentrated among urban and upper-middle-class households. For rural and lower-income India, gold, real estate, and bank deposits continue to be the primary savings channels. The mutual fund industry's AUM reflects a structurally narrow but growing base, with expansion into smaller cities ongoing but still in early stages.
The data provides context on how the savings landscape is changing, but any decision about reallocation depends on individual goals, time horizons, income stability, and risk tolerance. Please consult a SEBI-registered investment adviser before making any investment decision, as they can assess whether the current allocation matches your financial objectives and at what pace any reorientation is appropriate for your specific situation.
Structural factors supporting the shift, including digital access, the current rate environment, and increasing investor awareness, remain in place as of mid-2026. However, adverse tax changes, a reversal of rate cuts, or significant equity market corrections could slow or partially reverse the flow. No prediction about capital flows can be made with certainty, and past savings patterns are not indicative of future outcomes.
Disclaimer: This article is for general information and educational purposes only. It does not constitute investment advice, a recommendation, or an offer to buy or sell any securities or financial instruments. Data on household savings patterns, mutual fund flows, and bank deposit trends referenced in this article are based on publicly available sources including the Economic Survey 2025-26, RBI Monthly Bulletins, and AMFI data, and are subject to revision. Past patterns in household savings behaviour and asset class performance are not indicative of future outcomes. Investors should not make any investment decision based solely on this article. Please consult a SEBI-registered investment adviser or qualified financial professional before making any investment decision. Mutual fund investments are subject to market risks. Please read all scheme-related documents carefully before investing.
No spam. Only new posts, simple explainers, and practical money checklists for busy professionals.
Finnovate is a SEBI-registered financial planning firm that helps professionals bring structure and purpose to their money. Over 3,500+ families have trusted our disciplined process to plan their goals - safely, surely, and swiftly.
Our team constantly tracks market trends, policy changes, and investment opportunities like the ones featured in this Weekly Capsule - to help you make informed, confident financial decisions.
Learn more about our approach and how we work with you:
No comments yet. Start the conversation. What would you add?
No spam. Only new posts, simple explainers, and practical money checklists.
You may also like
Compare active equity mutual fund growth from September 2023 to September 2026, with categ...

Explore September 2026 ETF and index fund flows, with category-wise inflows, outflows, AUM...

Equity fund net inflows rose 30.61% to ₹38,306.55 crore in September 2026. Compare 13 ca...

Equity mutual funds received ₹29,329 crore in August 2026. See which categories saw the ...
Popular now

Learn how to easily download your NSDL CAS Statement in PDF format with our step-by-step g...

Looking for the best financial freedom books? Here’s a handpicked 2026 reading list with...

Learn what SIF investment means in India, SEBI rules, Rs 10 lakh minimum investment, avail...

Clear guide to mutual fund taxation in India for FY 2025–26 after July 2024 changes: equ...