
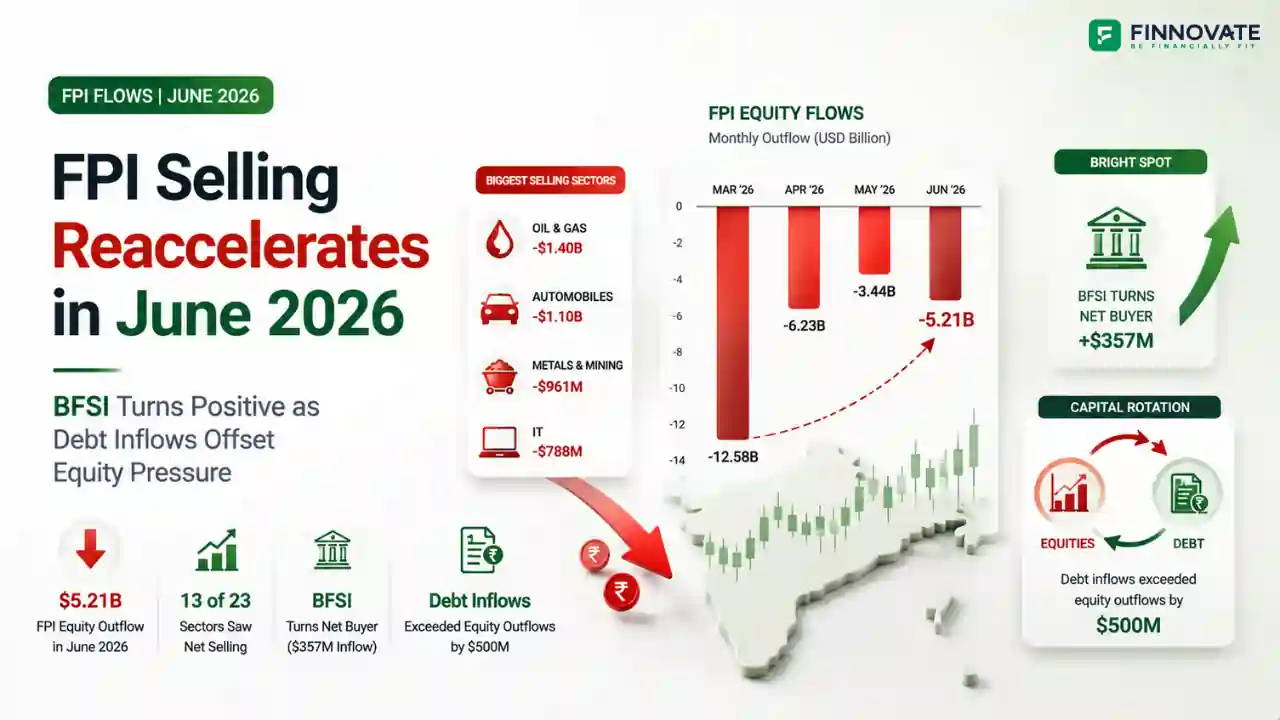
FPI Flows June 2026: $5.21 Billion Sold, BFSI Turns Buyer - Full Sectoral Data
FPIs sold $5.21 billion from Indian equities in June 2026. But BFSI turned net buyer at $3...
06 July 2026
For most of the past three decades, Indian equity investors have been told that the Nifty 50 delivers 12% to 15% CAGR over the long run. That assumption is being tested in a way it has rarely been before.
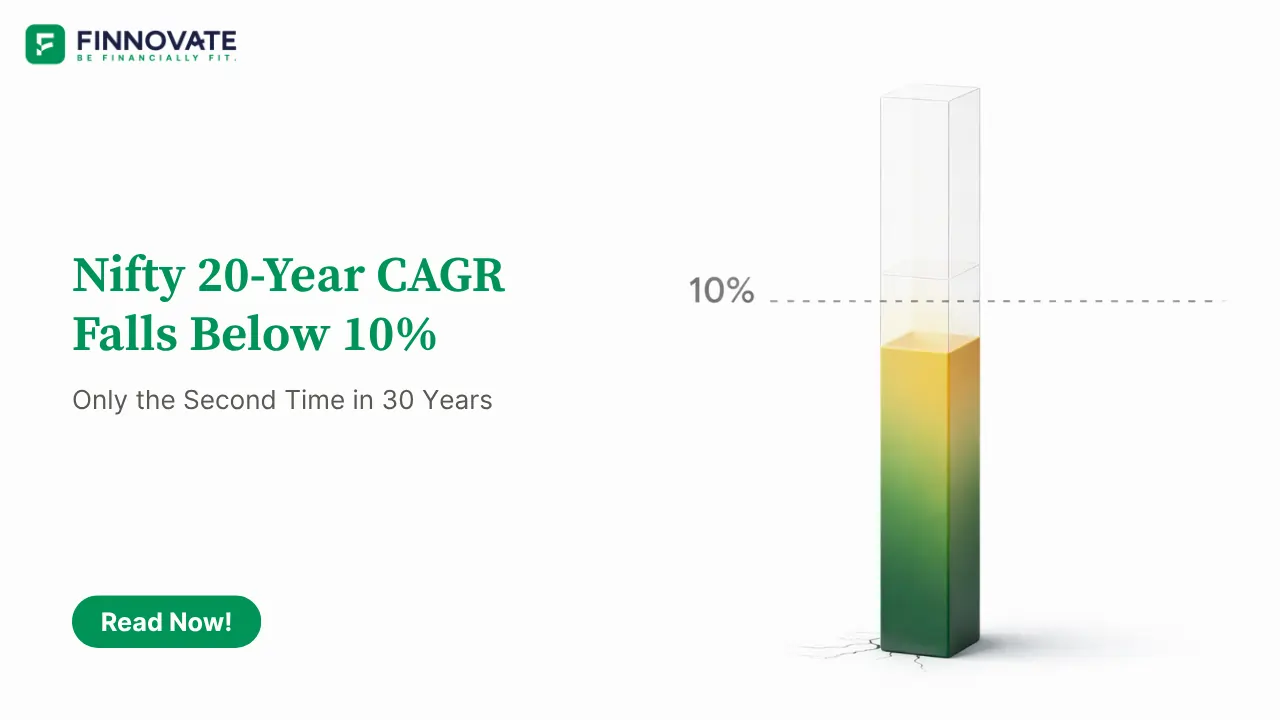
For FY26, the 20-year rolling CAGR of the Nifty 50 fell below 10%, only the second time this has happened in the index's approximately 30-year history. A sub-10% 20-year CAGR is not a market crash. It is something more insidious: a quiet, compounding compression of long-term returns that fundamentally changes the risk-reward equation for passive equity investors.
This article explains what the 20-year rolling CAGR measures, what the data shows from previous Nifty peaks, how Nifty and Sensex compare since inception, and what is driving the compression of long-term returns.
The 20-year rolling CAGR asks a simple question: if you had invested in the Nifty 20 years ago and held until today, what annualised return would you have earned?
Rolling the window forward one year at a time, rather than measuring from a fixed start date, removes the dependency on a single entry point. It gives a series of 20-year return observations across different market cycles, providing a more honest picture of what a passive long-term investor could have realistically expected.
Looking at Nifty's CAGR from four significant market peaks to the present reveals how dramatically entry point affects long-term outcomes.
| Previous Nifty Peak | Approx. Level | CAGR to End FY26 | Years Elapsed |
|---|---|---|---|
| January 2008 (pre-GFC) | ~6,288 | 7.33% | ~18 years |
| January 2015 (post-Modi euphoria) | ~8,775 | 8.89% | ~11 years |
| January 2020 (pre-COVID) | ~12,100 | 10.31% | ~6 years |
| October 2021 (FPI selling began) | ~18,600 | 4.62% | ~4.5 years |
Three readings stand out from this data.
The 2008 GFC peak tells the most uncomfortable story. An investor who bought the Nifty at its January 2008 peak and held for approximately 18 years through every subsequent bull and bear cycle earned just 7.33% CAGR. That is below the long-term average rate of inflation, and far from the 12-15% return narrative.
The October 2021 peak to present is 4.62% CAGR. This is a shorter 4.5-year window still within normal market cycle territory, so it should not be extrapolated. But it illustrates how sharply entry point can affect medium-term returns.
The January 2020 pre-COVID peak at 10.31% is the best outcome of the four, precisely because the COVID crash created a lower starting base for the subsequent recovery.
The pattern across all four is clear: the further from a peak you measure, the more returns compress, reflecting the drag from prolonged recovery periods before the index resumes sustained growth.
A longer view adds important context to the current compression.
The BSE Sensex, with its base date of 1979 and a starting level of 100, has delivered a CAGR of approximately 15.42% till end of FY26. Two important caveats apply. First, Sensex data prior to 1986 is back-calculated rather than based on actual traded data, as live BSE trading began only in 1986. Second, the index methodology changed from full market capitalisation to free-float in 2009, which affects strict comparability across the full period. With those qualifications, the long-run Sensex CAGR of approximately 15% is broadly representative of India's equity market wealth creation over four-and-a-half decades.
The Nifty 50, with its base date of 3 November 1995 and base value of 1,000, has delivered a CAGR of approximately 10.59% till end of FY26. That is nearly 500 basis points lower than the Sensex's long-run CAGR.
The gap points to an often-overlooked insight. The outsized Sensex CAGR relative to Nifty reflects the extraordinary returns generated in Indian equities during the 1980s, the decade before liberalisation. That was a period of genuine price-value disconnection, where quality businesses could be acquired at a fraction of intrinsic worth. The post-liberalisation period, which most investors cite as India's great equity success story, has actually produced more modest compounding than the pre-liberalisation decade that the Sensex's history captures but Nifty's does not.
Several factors are combining to compress Nifty's long-term return trajectory.
Corporate earnings growth, which drove the Nifty's stellar returns between 2003 and 2008 and again between 2014 and 2021, has been more subdued in recent years. Nominal GDP growth in FY26 was lower than expected partly due to record low inflation, which reduces the revenue base for corporate earnings even when real growth is healthy. Compressed earnings growth compresses index returns over time.
The Nifty's return from any given starting point is a function of both earnings growth and valuation change. Buying at elevated valuations makes valuation a headwind rather than a tailwind. Through much of the post-2014 period, Nifty has traded at or above its historical average PE multiple, reducing room for valuation expansion to boost returns.
FPIs have been net sellers of Indian equities through much of FY25 and all of FY26, culminating in the record $12.58 billion monthly outflow in March 2026. Sustained FPI selling creates persistent index pressure. The rupee's depreciation from approximately ₹83 per dollar in early FY25 to ₹95 by end of FY26 compounded the pain for foreign investors, reinforcing the outflow cycle. We covered the full FPI sectoral breakdown in FPI March 2026: Sector-Wise Breakdown.
The US-Iran conflict and its knock-on effects on crude prices, the rupee, inflation expectations, and investor sentiment significantly compressed FY26 returns. Between January and March 2026, the Nifty fell approximately 15%, with most of the damage in March. Events of this nature can set back long-term return trajectories by several years when they coincide with already elevated valuations and compressed earnings momentum.
The sub-10% 20-year CAGR is not a reason to abandon equity investing. History shows that these periods of return compression are typically followed by recovery. The second previous instance of the 20-year CAGR falling below 10% was itself followed by a multi-year period of above-average returns as the base normalised.
However, it does raise three honest questions worth carrying into FY27.
| Question | What the Data Suggests |
|---|---|
| Is a 12-15% long-term Nifty CAGR still realistic? | Over very long periods it has been. But entry point matters more than most investors acknowledge. Buying at elevated valuations during high-momentum phases has historically produced below-average 10-15 year returns. |
| Does passive index investing still make sense? | Peak-to-date return data shows that even long holding periods cannot fully compensate for poor entry points. This does not invalidate passive investing, but suggests that SIP-based systematic investing across a cycle is more reliable than lump-sum entry at peaks. |
| Should the 12-15% return assumption be revised for financial planning? | Stress-testing financial plans against a more conservative 10-11% long-term scenario may be prudent, being more consistent with Nifty's actual since-inception CAGR and its recent 20-year rolling returns. |
It means an investor who put money into a Nifty index fund 20 years ago and held until today earned less than 10% compounded annually. Entry point, valuation at the time of investment, and the specific 20-year window all matter more than the broad long-run average suggests.
The Sensex started in 1979, giving it 16 extra years including the 1980s, a decade of exceptional returns from genuine price-value disconnection before liberalisation. The Nifty's base is 1995 and misses that early compounding. The nearly 500 bps gap reflects the pre-liberalisation decade, not a structural difference between the two indices today.
The 7.33% CAGR from the 2008 peak is lower than the long-run average but still positive over 18 years. Whether that justified staying invested depends on the alternative and the investor's specific goal and horizon. Please consult a SEBI-registered investment adviser before making any investment decisions.
Historical data does not support abandoning passive equity investing. What it suggests is that return expectations used for financial planning should be calibrated conservatively, and systematic investing across market cycles is more reliable than lump-sum entry at peaks.
Periods of compressed long-term returns have historically been followed by above-average recovery phases. Individual decisions depend on personal goals, time horizon, and risk tolerance. Please consult a SEBI-registered investment adviser before making any investment decisions.
Disclaimer: This article is for general information and educational purposes only. It does not constitute investment advice, a recommendation, or an offer to buy or sell any securities or financial instruments. All CAGR calculations from previous Nifty peaks and the 20-year rolling CAGR figures are based on Finnovate Research analysis of NSE historical data and are subject to verification. Sensex historical data pre-1986 is back-calculated and the index methodology changed in 2009, both of which affect long-period return comparisons. Past performance of any index is not indicative of future returns. Please consult a SEBI-registered investment adviser or qualified financial professional before making any investment decision. Equity investments are subject to market risks.
No spam. Only new posts, simple explainers, and practical money checklists for busy professionals.
Finnovate is a SEBI-registered financial planning firm that helps professionals bring structure and purpose to their money. Over 3,500+ families have trusted our disciplined process to plan their goals - safely, surely, and swiftly.
Our team constantly tracks market trends, policy changes, and investment opportunities like the ones featured in this Weekly Capsule - to help you make informed, confident financial decisions.
Learn more about our approach and how we work with you:


No spam. Only new posts, simple explainers, and practical money checklists.
You may also like
FPIs sold $5.21 billion from Indian equities in June 2026. But BFSI turned net buyer at $3...

Amazon Now is targeting 100 Indian cities with 1,000+ micro-fulfilment centres. But the re...

RBI replaced its NBFC-UL scoring system with a single ₹1 lakh crore asset test on June 2...

Quick commerce runs on dense urban clusters - a model that covers 8% of India's population...
Popular now
Learn how to easily download your NSDL CAS Statement in PDF format with our step-by-step g...
Learn what SIF investment means in India, SEBI rules, Rs 10 lakh minimum investment, avail...
Looking for the best financial freedom books? Here’s a handpicked 2026 reading list with...
Clear guide to mutual fund taxation in India for FY 2025–26 after July 2024 changes: equ...