

Can India Build the Hardware Behind the AI Boom?
Explore India’s AI hardware opportunity through the proposed Adani–Jabil venture, from...
14 October 2026

Finnovate’s editorial team researches and creates financial content using trusted sources, regulatory references and inputs from subject experts.
Data period: June 2026 | Sources: MoSPI, Office of the Economic Adviser and RBI
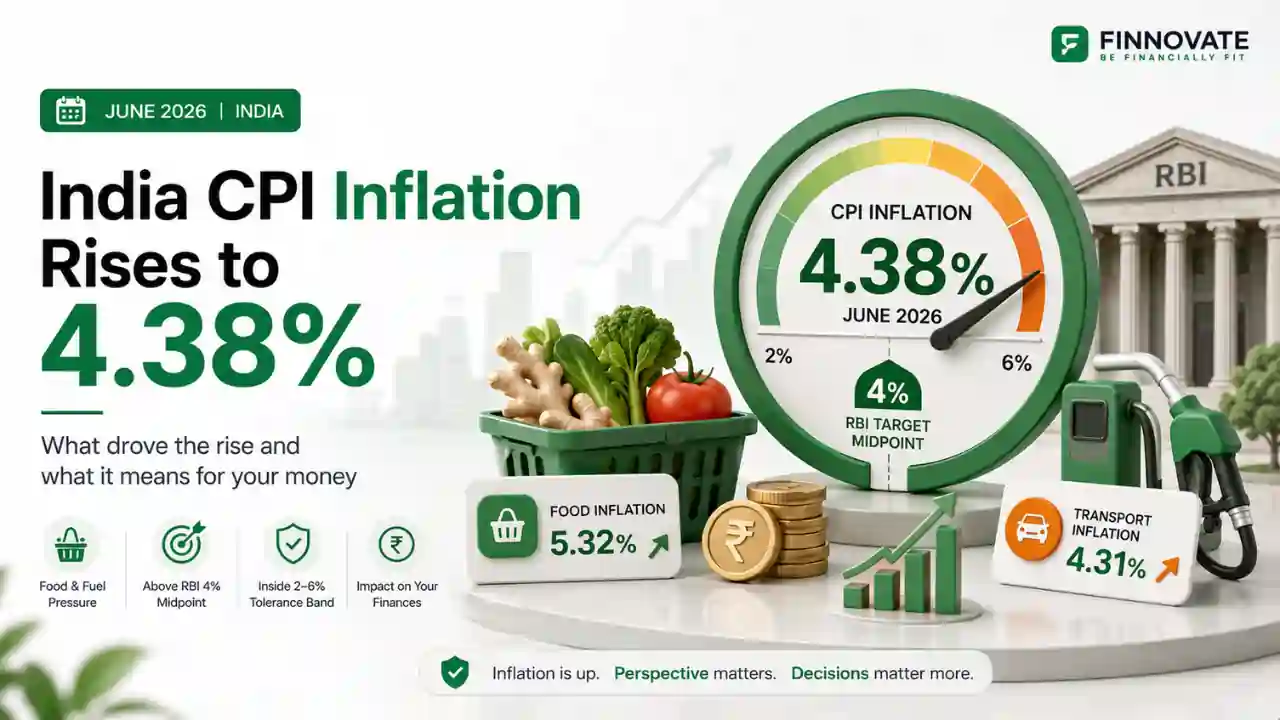
India's retail inflation rose to 4.38% in June 2026 from 3.93% in May. It moved above the RBI's 4% inflation target midpoint for the first time in 17 months, but it remained inside the official 2% to 6% tolerance band. Food inflation and a sharp rise in transport inflation were the main pressures. A rate hike is not automatic because the RBI also looks at the persistence of inflation, core price pressure, growth, crude oil and the monsoon.
The Ministry of Statistics and Programme Implementation, or MoSPI, reported that the Consumer Price Index rose 4.38% year-on-year in June 2026. Rural inflation was 4.74%, urban inflation was 3.92%, and food inflation measured through the Consumer Food Price Index was 5.32%. The June headline reading was slightly above the 4.3% median estimate in a Reuters poll.
India CPI inflation June 2026 at a glance
Headline CPI inflation in June 2026, 45 basis points higher than May
Consumer food inflation, led by sharp price increases in ginger and tomato
Transport inflation, up sharply after fuel-price increases began passing through
Headline inflation increased for a third consecutive month, from 3.48% in April to 3.93% in May and 4.38% in June. The April-to-June average was approximately 3.93%, still below the RBI's 4.2% projection for the first quarter of FY 2026-27.
| Inflation Measure | June 2026 | May 2026 | April 2026 | Change vs May |
|---|---|---|---|---|
| Headline CPI | 4.38% | 3.93% | 3.48% | +45 bps |
| Consumer Food Price Index | 5.32% | 4.78% | 4.20% | +54 bps |
| Food and Beverages | 5.05% | 4.55% | 4.01% | +50 bps |
| Transport | 4.31% | 1.75% | -0.01% | +256 bps |
| Restaurants and Accommodation | 6.91% | 5.75% | 4.20% | +116 bps |
| Personal Care, Social Protection and Miscellaneous Goods and Services | 16.72% | 18.46% | 17.66% | -174 bps |
| Rural CPI | 4.74% | 4.25% | 3.74% | +49 bps |
| Urban CPI | 3.92% | 3.53% | 3.16% | +39 bps |
India introduced a new CPI series with base year 2024=100 in January 2026. Comparisons with inflation readings before January 2026 require care because the basket, weights and base year changed.
Food remained the most direct pressure on household budgets. Consumer food inflation rose from 4.78% in May to 5.32% in June. Within the detailed item data, ginger prices increased 50.41% year-on-year, tomato prices rose 31.92%, and raisin and monacca prices rose 20.52%.
Some items became cheaper and reduced the overall food impact. Potato prices were down 20.34%, peas were down 9.67%, and cumin was down 3.75% year-on-year.
| Items with High Inflation | June Inflation | Items with Negative Inflation | June Inflation |
|---|---|---|---|
| Silver jewellery | 133.21% | Potato | -20.34% |
| Ginger | 50.41% | Peas | -9.67% |
| Gold, diamond and platinum jewellery | 36.82% | Motor car and jeep | -6.89% |
| Tomato | 31.92% | Cumin | -3.75% |
| Raisin and monacca | 20.52% | Motorcycle and scooter | -3.49% |
The forward food outlook depends on the timing and distribution of the monsoon, the development of El Niño conditions, crop output and supply management. The RBI's June policy statement flagged monsoon and El Niño risks, while also noting that adequate foodgrain stocks and satisfactory reservoir levels provided some protection.
Transport recorded the sharpest month-on-month change among the major CPI divisions. The RBI said retail petrol and diesel prices were increased cumulatively by 7.4% and 8.4%, respectively, in May 2026. The central bank estimated that these increases would add about 36 basis points to headline CPI as the impact passed through to consumers.
Crude oil remains a key risk because India imports most of its crude requirement. Brent crude was trading near $84 to $85 per barrel on July 16, 2026, after renewed tension between the United States and Iran. Oil prices can affect transport, logistics, aviation, packaging and production costs, although the final retail impact also depends on taxes, refining margins and government pricing decisions.
The rise was not limited to food and transport. Inflation in restaurants and accommodation services increased to 6.91% from 5.75%. Clothing and footwear rose to 3.23% from 2.98%, while furnishings and routine household maintenance increased to 2.19% from 1.89%.
These changes matter because they show cost pressure appearing across several parts of the basket. However, one month of broader increases is not enough to conclude that inflation has become fully generalised. The RBI will watch whether these increases continue and whether they begin affecting wages, expectations and a wider set of services.
The broad division that includes personal care, social protection and miscellaneous goods and services recorded inflation of 16.72%. This was still the highest division-level reading, but it fell from 18.46% in May.
Silver jewellery inflation remained exceptionally high at 133.21%, while gold, diamond and platinum jewellery inflation was 36.82%. These figures explain why the division remained elevated, but they should not be described as the main reason for the June monthly acceleration because the division's inflation rate actually declined from May.
The rural-urban gap was 82 basis points in June. Rural food inflation was 5.45%, compared with 5.09% in urban India. Rural inflation was also higher in clothing, housing and utilities, furnishings, transport, and the personal-care and miscellaneous division. Urban inflation was higher in areas such as education, restaurants and accommodation, and some health services.
The gap matters because rural households generally have a different consumption pattern from urban households. A stronger rise in food and transport costs can reduce disposable income available for non-essential spending. However, CPI is an average index. An individual household's actual inflation rate depends on where it lives and how it spends.
Wholesale Price Index inflation rose to 9.87% in June from 9.68% in May, according to the Office of the Economic Adviser under the Ministry of Commerce and Industry. The major WPI groups recorded the following inflation rates:
The official release identified mineral oils, food articles, basic metals, and chemicals and chemical products as major drivers. This signals pressure at the wholesale and producer level, but WPI does not pass into CPI in a fixed proportion or within a fixed time. Businesses may absorb costs, improve efficiency, change margins or pass only part of the increase to consumers.
What the data suggests
June's 4.38% CPI reading increases the RBI's need to watch inflation, but it does not make a repo-rate hike automatic. Inflation remains inside the 2% to 6% tolerance band, and the April-to-June average was about 3.93%. The decision will depend on whether food and fuel pressures persist and spread into core inflation, wages and inflation expectations.
At its June 2026 meeting, the Monetary Policy Committee kept the repo rate unchanged at 5.25% and retained a neutral stance. The RBI projected FY 2026-27 headline inflation at 5.1%, with quarterly forecasts of 4.2% in Q1, 5.1% in Q2, 5.9% in Q3 and 5.4% in Q4. It projected core inflation at 4.7% for the year.
The June data present a mixed picture for monetary policy:
Economist views are divided. Reuters reported after the June CPI release that several institutions, including Citi, SBI, Nomura and ANZ, had reduced expectations of an immediate rate hike and expected the RBI to wait for more data. This outlook can change quickly if crude oil rises further, the monsoon weakens, or core inflation remains elevated.
Inflation reduces the purchasing power of fixed returns. A 7% annual return with inflation at 4.38% gives an exact pre-tax real return of approximately 2.51%, assuming both rates remain unchanged for a year.
Real return formula:
Real return = [(1 + nominal return) ÷ (1 + inflation)] - 1
Example: [(1.07 ÷ 1.0438) - 1] × 100 = approximately 2.51% before tax
Tax can reduce the real return further. However, emergency funds and short-term money should not be moved into risky investments only to beat inflation. Their first purpose is liquidity and capital stability.
Higher inflation can keep bond yields elevated or change expectations about future policy rates. Rising yields can reduce the market value of existing long-duration bonds, while also creating better reinvestment opportunities. The effect differs by duration, credit quality, taxation and investment horizon.
Inflation does not affect every company in the same way. Businesses with pricing power may pass on costs, while companies with weak margins or high input dependence may face pressure. Investors should focus on diversification and asset allocation rather than trying to trade one monthly inflation number.
High jewellery inflation shows how strongly precious-metal prices have risen in rupee terms. It does not, by itself, mean that gold or silver will continue rising. Buying only because recent inflation is high can lead to poor timing. Allocation should be linked to the role of the asset in the portfolio, not recent price momentum.
The return shown on an investment statement is not the same as the return that improves purchasing power. The FinnFit Financial Fitness Test helps review whether your savings, investments, insurance and goals are working together.
Take the FinnFit TestIndia's year-on-year Consumer Price Index inflation was 4.38% in June 2026. It increased from 3.93% in May and 3.48% in April.
It moved above the RBI's 4% target midpoint, but it did not breach the upper tolerance limit. India's inflation framework allows CPI inflation to move within a 2% to 6% band around the 4% target.
The main pressures were food and transport. Food inflation rose to 5.32%, while transport inflation increased sharply to 4.31% after fuel-price increases began passing through to consumer prices. Restaurants, clothing and household costs also recorded higher inflation.
Consumer food inflation was 5.32%. Ginger, tomato and raisin prices recorded high year-on-year increases, while potatoes, peas and cumin were cheaper than a year earlier.
Rural inflation was 4.74%, compared with urban inflation of 3.92%. Rural price pressure was stronger in food, clothing, housing and utilities, furnishings, transport and the personal-care and miscellaneous division. Differences in household spending patterns also affect the rural-urban gap.
Not necessarily. The RBI will consider whether inflation remains high for several months, whether food and fuel pressure spreads to underlying inflation, and how growth, crude oil and the monsoon develop. The June reading alone does not require a rate increase.
CPI measures price changes faced by consumers across goods and services. WPI measures wholesale price changes, mainly across goods, before they reach the final consumer. CPI is the measure used for the RBI's inflation target.
A 7% fixed-deposit return gives an exact pre-tax real return of about 2.51% when inflation is 4.38%. The post-tax real return can be lower depending on the investor's tax rate.
It is above the RBI's 4% target midpoint but below the 6% upper tolerance level. The direction and persistence matter more than one number. A continued rise across several months would be more concerning than a temporary increase caused mainly by food and fuel.
Disclaimer: This article is for general information and educational purposes only. It is not investment advice, a recommendation, or an offer to buy or sell any security or financial product. Inflation, interest rates, asset prices and tax outcomes can change. Investment decisions should consider goals, time horizon, risk capacity, liquidity needs, taxation and the full financial plan. Please consult a SEBI-registered investment adviser before acting on this information.
No spam. Only new posts, simple explainers, and practical money checklists for busy professionals.
Finnovate is a SEBI-registered financial planning firm that helps professionals bring structure and purpose to their money. Over 3,500+ families have trusted our disciplined process to plan their goals - safely, surely, and swiftly.
Our team constantly tracks market trends, policy changes, and investment opportunities like the ones featured in this Weekly Capsule - to help you make informed, confident financial decisions.
Learn more about our approach and how we work with you:
No comments yet. Start the conversation. What would you add?
No spam. Only new posts, simple explainers, and practical money checklists.
You may also like
Explore India’s AI hardware opportunity through the proposed Adani–Jabil venture, from...
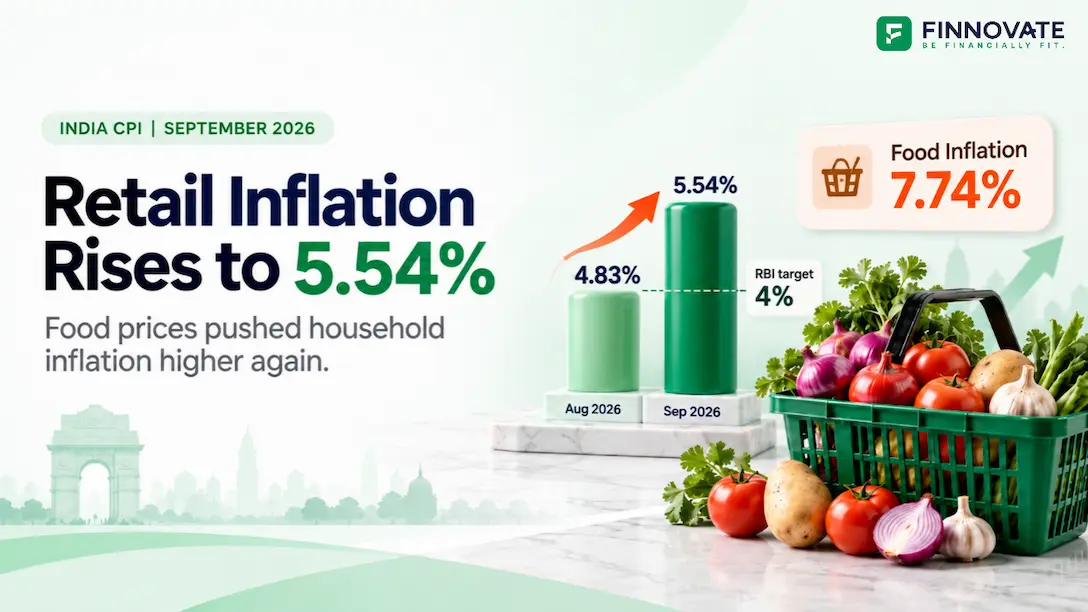
India’s CPI inflation rose to 5.54% in September 2026. Compare monthly trends, food pric...
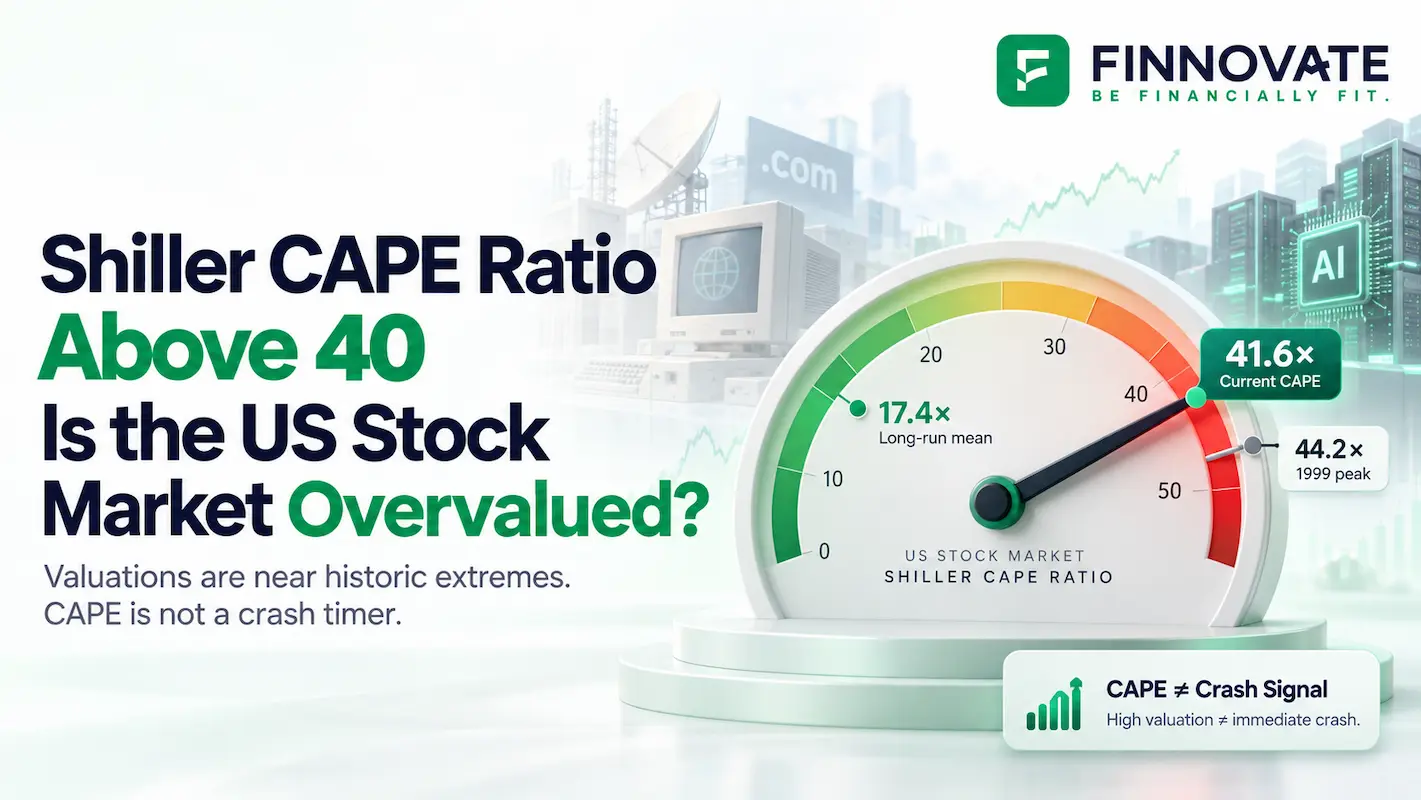
The Shiller CAPE ratio is near its 1999 peak. Explore what it means for US stock valuation...

Can Starlink change internet access in India? Explore why Jio and Airtel signed deals, how...
Popular now

Learn how to easily download your NSDL CAS Statement in PDF format with our step-by-step g...

Looking for the best financial freedom books? Here’s a handpicked 2026 reading list with...

Learn what SIF investment means in India, SEBI rules, Rs 10 lakh minimum investment, avail...

Clear guide to mutual fund taxation in India for FY 2025–26 after July 2024 changes: equ...