

Equity Fund AUM June 2026: Price Moves Did More Work Than Flows
Active equity fund AUM rose 3.3% to ₹37.34 lakh crore in June 2026. Price accretion of �...
15 July 2026
Data period: May 2025 to April 2026 | Source: AMFI monthly reports
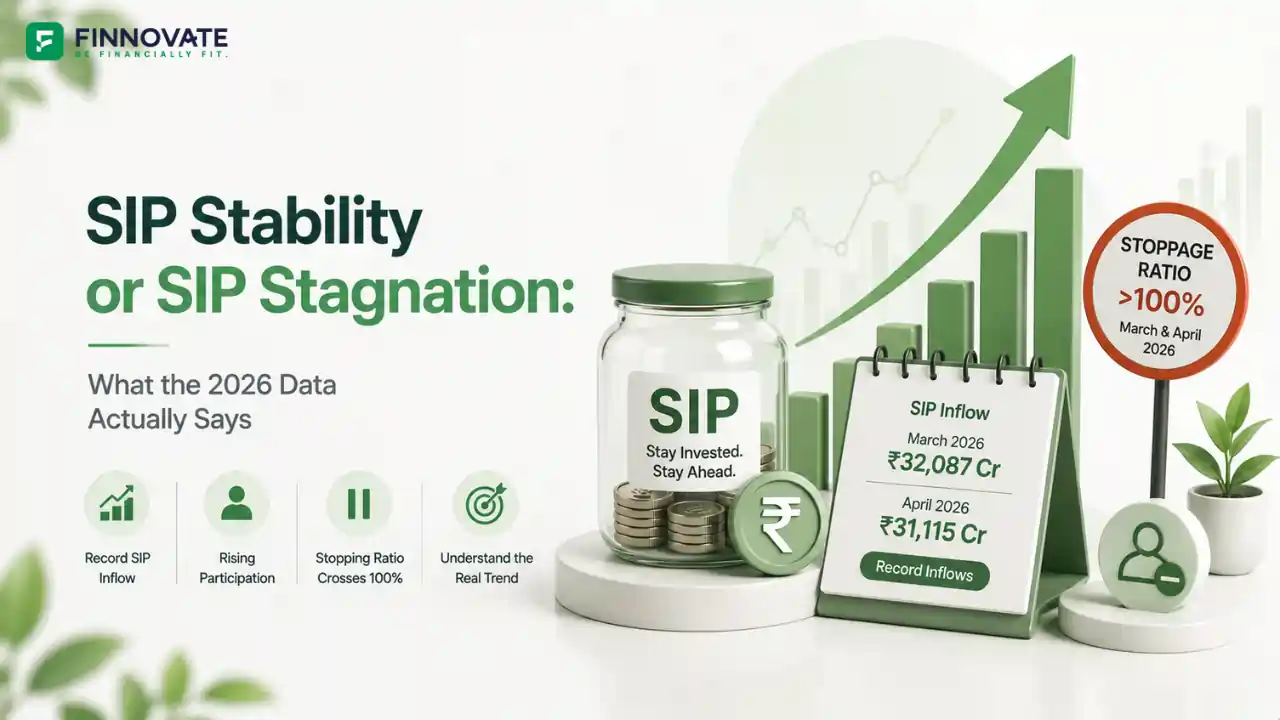
Two things are simultaneously true about India's SIP story in 2026. Monthly SIP inflows hit a record ₹32,087 crore in March 2026, and April 2026 followed at ₹31,115 crore. At the same time, AMFI data confirms the SIP stoppage ratio crossed 100% in both months, meaning more SIP accounts were being discontinued or maturing than new ones were being registered.
Both facts are real. The question is what they mean together, and whether the underlying SIP habit is structurally sound or quietly narrowing.
Quick answer: The SIP stoppage ratio exceeded 100% in March and April 2026 per AMFI data, meaning more accounts ended than started. But SIP inflows remained above ₹31,000 crore and SIP AUM reached ₹16.85 lakh crore, representing 20.57% of total industry AUM. The account-level churn and the money-level stability are telling two different parts of the same story.
The table below tracks SIP intensity across six dimensions over the past 12 months: total AUM, SIP AUM, SIP AUM as a share of total AUM, total folios, SIP outstanding accounts, and SIP accounts as a share of total folios.
| Month | Total AUM (₹ Cr) | SIP AUM (₹ Cr) | SIP AUM Ratio | Total Folios (Cr) | SIP Outstanding Accounts (Cr) | SIP Accounts / Total Folios |
|---|---|---|---|---|---|---|
| Apr-26 | 81,92,388 | 16,85,126 | 20.57% | 27.5311 | 10.4426 | 37.93% |
| Mar-26 | 73,73,377 | 15,10,943 | 20.49% | 27.3934 | 10.4484 | 38.14% |
| Feb-26 | 82,02,956 | 16,64,085 | 20.29% | 27.0571 | 10.4540 | 38.64% |
| Jan-26 | 81,01,306 | 16,36,082 | 20.20% | 26.6314 | 10.2938 | 38.65% |
| Dec-25 | 80,23,379 | 16,63,369 | 20.73% | 26.1254 | 10.1073 | 38.69% |
| Nov-25 | 80,80,370 | 16,52,665 | 20.45% | 25.8614 | 10.0184 | 38.74% |
| Oct-25 | 79,87,940 | 16,25,305 | 20.35% | 25.6004 | 9.8788 | 38.59% |
| Sep-25 | 75,61,309 | 15,52,303 | 20.53% | 25.1923 | 9.7274 | 38.61% |
| Aug-25 | 75,18,703 | 15,18,368 | 20.19% | 24.8909 | 9.5904 | 38.53% |
| Jul-25 | 75,35,971 | 15,19,456 | 20.16% | 24.5724 | 9.4497 | 38.46% |
| Jun-25 | 74,40,671 | 15,30,574 | 20.57% | 24.1345 | 9.1932 | 38.09% |
| May-25 | 72,19,611 | 14,61,360 | 20.24% | 23.8313 | 9.0557 | 38.00% |
The SIP stoppage ratio measures SIP accounts discontinued or matured as a percentage of new SIP registrations in a given month. In many pre-clean-up periods, the ratio was commonly seen in the 50% to 70% range, though it has moved higher in recent years. A ratio above 100% means new registrations are being outpaced by stoppages.
One distinction matters before drawing conclusions. A completed SIP is one where the investor chose a fixed tenure at registration and that tenure has ended. This is the investment plan working as intended. A discontinued SIP is one the investor cancelled before completion. AMFI's published data combines both into one stoppage figure, so a ratio above 100% does not by itself confirm investor distress.
The SIP stoppage ratio reached elevated levels in early 2025, including values well above 100%, because AMFI undertook a systematic clean-up of approximately 1.43 crore dormant folios between January and April 2025. That was a one-time reconciliation event, not a signal of investor behaviour. So far, there is no publicly stated AMFI-style reconciliation explanation for the March and April 2026 rise. The stoppage ratio crossing 100% in these months appears to reflect actual account behaviour rather than a data clean-up exercise.
The slowdown in SIP account growth is not explained by any single factor. Five forces appear to be operating at the same time, each adding pressure in a different way.
| # | Reason | What it reflects | Signal |
|---|---|---|---|
| 1 | Equity market volatility | Nifty 50 peaked in September 2024 and declined through subsequent months. Persistent FPI selling compounded the pressure. Retail investors who entered SIPs during the 2021-2024 bull run have seen prolonged flat or negative mark-to-market returns. | Negative |
| 2 | Alternate asset outperformance | Gold and silver delivered strong returns over the past year while equity mutual funds delivered broadly flat returns. The visible contrast may have created a pull toward precious metals and away from systematic equity investing. | Negative |
| 3 | Shift to discretionary investing | Lumpsum AUM and lumpsum folios have grown at comparable or slightly faster rates than SIP metrics in recent months. Some investors may be choosing to deploy money on their own timing rather than through a pre-committed monthly debit. | Negative |
| 4 | Rising baseline stoppage rate | The historically "normal" 50-70% range is itself elevated relative to pre-2020 norms, when the ratio stayed below 50%. The upward drift in the baseline suggests investor tenure may have been shortening across successive market cycles. | Caution |
| 5 | Cleaner SIP account base | After the 2025 reconciliation removed approximately 1.43 crore defunct SIP folios, the current SIP account base is cleaner than before. Against this cleaner base, the March and April 2026 contraction in outstanding SIP accounts is harder to explain away as a data artefact. | Caution |
The SIP AUM ratio and the SIP outstanding account count are pulling in different directions. Understanding the divergence is the key to reading the current data correctly.
The SIP AUM stability reflects the fact that monthly contribution value remains strong even after two months of SIP account contraction. Monthly inflows of ₹31,000 to ₹32,000 crore show that continuing SIP investors are still committing significant money. The money is holding even as the account count shifts.
The data suggests SIP growth is no longer broadening at the same pace. Outstanding SIP accounts contracted in March and April 2026, while total mutual fund folios rose. To confirm whether small-ticket investors are actually exiting, ticket-size-wise SIP data would be needed, which AMFI does not publish at that level of granularity. What is observable is the account count, and it has contracted.
The stability case rests on the money flows. SIP inflows at ₹31,000 to ₹32,000 crore per month are at or near record levels. SIP AUM at ₹16.85 lakh crore is at an all-time high. The industry is not losing systematic investment money in aggregate. Contributing SIP accounts stood at approximately 9.65 crore in April 2026. By these measures, the SIP habit is intact.
The concern lies in the SIP account-level indicators. The SIP stoppage ratio above 100% for two consecutive months in 2026, outside the reconciliation-driven 2025 spike, indicates net SIP account attrition. However, this did not translate into an industry-wide folio contraction, as total mutual fund folios continued to rise in April 2026.
The traditional framing of SIP investing, which encourages registering a monthly debit and holding for 8 to 10 years while compounding works, appears to be under competitive pressure from two sides: the short-term appeal of asset classes delivering visible returns, and the rise of discretionary investing platforms that make lumpsum market-timing easier than before. These forces do not invalidate the SIP thesis, but they suggest the industry's dependence on an automatic, passive SIP habit as its primary growth engine may be less reliable going forward than it has been.
For context on how FPI selling has affected broader market sentiment over this period, see FPI Outflows in Early March 2026 and Passive Fund Flows in India: Trend or Momentum.
Market volatility, changing asset class returns, and life events all affect whether an existing SIP plan still fits. The FinnFit Financial Fitness Test takes 3 minutes and shows you where your plan stands today.
Take the FinnFit TestThe SIP stoppage ratio measures SIP accounts discontinued or matured as a percentage of new SIP registrations in a given month. A ratio above 100% means more accounts are ending than starting in that month. AMFI's published data combines completed tenures and active cancellations into one figure, so the ratio does not by itself confirm investor distress.
SIP inflows and SIP AUM are at record levels, which argues against structural weakness. However, the stoppage ratio above 100% and the decline in outstanding SIP accounts in March and April 2026 suggest that SIP account-level growth has slowed, even though total mutual fund folios continued to rise. The money is holding; the account count is thinning.
The primary factors appear to be equity market volatility since September 2024, persistent FPI selling creating negative sentiment, and strong returns from alternate asset classes making equity SIP returns look unfavourable in comparison. A broader shift toward discretionary investing, supported by easier lumpsum investment platforms, may also have contributed.
Yes. SIP AUM grew 15.32% over the past year to reach ₹16.85 lakh crore in April 2026. Monthly contribution value has remained strong even as the number of outstanding SIP accounts contracted in March and April 2026.
A completed SIP is one where the investor registered a fixed-tenure plan and the tenure ended as planned. A discontinued SIP is one cancelled before its natural end. AMFI's stoppage ratio combines both, which means a high ratio does not automatically indicate investor distress. The published data does not disaggregate the two categories. Please consult a SEBI-registered investment adviser to review whether your own SIP plan remains aligned with your financial goals.
Disclaimer: This article is for general information and educational purposes only. It does not constitute investment advice, a recommendation, or an offer to buy or sell any securities or financial instruments. All SIP AUM, folio, and flow data referenced in this article is sourced from AMFI monthly reports. Analysis period starts May 2025 to exclude the impact of AMFI's folio reconciliation exercise completed in April 2025. Past SIP flow trends and market behaviour are not indicative of future outcomes. Please consult a SEBI-registered investment adviser before making any investment decision. Mutual fund investments are subject to market risks. Please read all scheme-related documents carefully before investing.
No spam. Only new posts, simple explainers, and practical money checklists for busy professionals.
Finnovate is a SEBI-registered financial planning firm that helps professionals bring structure and purpose to their money. Over 3,500+ families have trusted our disciplined process to plan their goals - safely, surely, and swiftly.
Our team constantly tracks market trends, policy changes, and investment opportunities like the ones featured in this Weekly Capsule - to help you make informed, confident financial decisions.
Learn more about our approach and how we work with you:
No comments yet. Start the conversation. What would you add?
No spam. Only new posts, simple explainers, and practical money checklists.
You may also like
Active equity fund AUM rose 3.3% to ₹37.34 lakh crore in June 2026. Price accretion of �...

Passive fund inflows rebounded to ₹16,724 crore in June 2026, with gold and silver ETFs ...

Equity fund folios grew 22.96% CAGR and AUM 29.69% over 3 years. See which of the 11 categ...

Active equity MF inflows fell 40.4% in May 2026 to ₹22,908 crore, but still drove more A...
Popular now

Learn how to easily download your NSDL CAS Statement in PDF format with our step-by-step g...

Learn what SIF investment means in India, SEBI rules, Rs 10 lakh minimum investment, avail...

Looking for the best financial freedom books? Here’s a handpicked 2026 reading list with...

Clear guide to mutual fund taxation in India for FY 2025–26 after July 2024 changes: equ...