Only 5 Nifty 50 Stocks Rose in September. Which Ones Held Up?

Finnovate’s editorial team researches and creates financial content using trusted sources, regulatory references and inputs from subject experts.
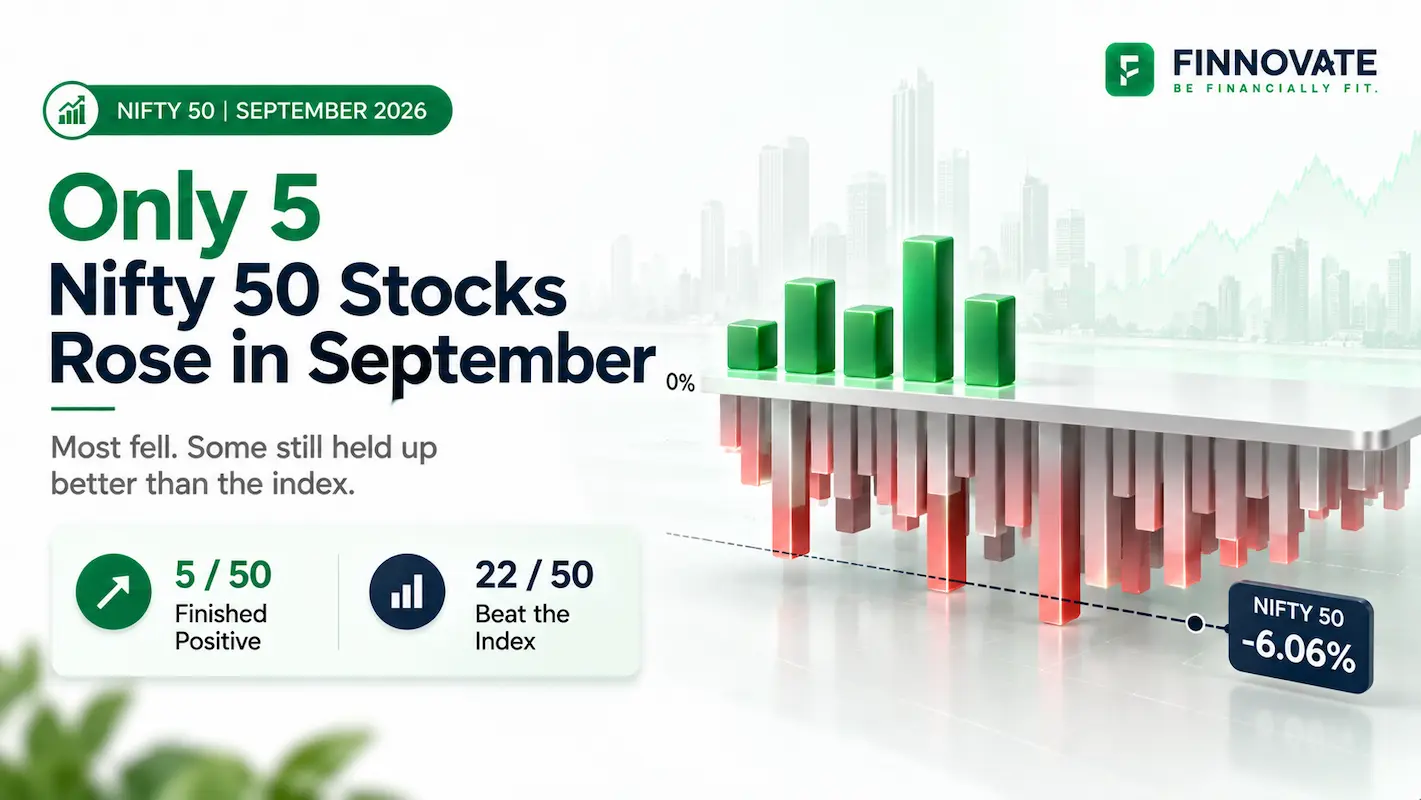
Adani Ports gained 12.88% in September 2026, while the Nifty 50 fell 6.06%. It was one of just five stocks in the month-end Nifty 50 list to finish September higher.
Dr. Reddy’s Laboratories, Coal India, ITC and Adani Enterprises were the other gainers. The remaining 45 stocks declined.
But the monthly results look different when placed alongside annual performance. Shriram Finance fell 11.46% in September yet remained 59.50% higher over one year. Titan lost 10.10% during the month but retained a 36.23% annual gain.
The five stocks that gained in September
| Stock | September 2026 price return |
|---|---|
| Adani Ports | +12.88% |
| Dr. Reddy’s Laboratories | +6.81% |
| Coal India | +5.79% |
| ITC | +2.84% |
| Adani Enterprises | +1.55% |
| Nifty 50 | −6.06% |
Monthly returns compare August 31 and September 30 closing prices. Dividends are excluded.
Although only five stocks rose, 22 of the 50 outperformed Nifty. This includes stocks that fell less than the index.
Tata Steel, for example, declined just 0.03%, while Kotak Mahindra Bank fell 0.57%. Both held up better than Nifty, although neither delivered a positive monthly price return.
How the broader performance comparison works
A monthly return measures what happened between two closing dates. It does not show whether a stock has retained gains from earlier months or how far it remains below its yearly high.
Let’s use a simple method to bring these different views together. For this analysis, we’ll compare each stock on four measures:
| Measure | What it shows |
|---|---|
| September return | Price change during the month |
| One-year return | Price change between September 30, 2025 and September 30, 2026 |
| Above the 52-week low | How far the September-end price stood above the yearly low |
| Below the 52-week high | How far the September-end price stood below the yearly high |
We’ll rank each stock on each measure. Higher returns and a larger recovery from the low receive better ranks, as does a smaller distance below the high. We’ll then average those four ranks to arrive at a combined score.
A lower combined score ranks higher. This is our method for organising the historical price comparison in this article. It is not an official NSE ranking or an assessment of investment suitability.
The combined comparison covers 48 stocks. Hindustan Unilever and Tata Motors Passenger Vehicles are excluded because demergers during the period complicate comparable annual returns and high-low measurements. Both remain included in the 50-stock monthly comparison.
The top 20 by combined performance score
Adani Ports ranked first across the four measures, followed by Adani Enterprises and Kotak Mahindra Bank.
| Company | September return | One-year return | Above 52-week low | Below 52-week high | Combined score |
|---|---|---|---|---|---|
| Adani Ports | +12.88% | +28.13% | 39.19% | 4.91% | 2.75 |
| Adani Enterprises | +1.55% | +19.51% | 65.62% | 10.53% | 4.75 |
| Kotak Mahindra Bank | −0.57% | +4.63% | 20.69% | 7.99% | 10.50 |
| JSW Steel | −4.15% | +9.69% | 16.79% | 7.22% | 12.00 |
| Eternal | −2.47% | −1.69% | 50.52% | 13.15% | 12.75 |
| Coal India | +5.79% | +8.99% | 14.99% | 13.49% | 13.00 |
| Apollo Hospitals | −8.24% | +10.21% | 21.94% | 9.98% | 13.50 |
| Titan | −10.10% | +36.23% | 36.88% | 11.56% | 13.75 |
| Grasim Industries | −9.17% | +11.06% | 22.35% | 10.24% | 14.50 |
| Dr. Reddy’s Laboratories | +6.81% | +0.76% | 11.99% | 12.86% | 15.00 |
| Tata Steel | −0.03% | +9.20% | 15.14% | 17.87% | 15.25 |
| Shriram Finance | −11.46% | +59.50% | 60.80% | 14.82% | 15.50 |
| Bajaj Auto | −10.35% | +25.30% | 28.06% | 12.80% | 15.75 |
| BSE | −5.79% | +51.55% | 51.93% | 30.47% | 16.50 |
| Sun Pharma | −8.47% | +13.94% | 14.71% | 11.25% | 16.50 |
| Hindalco | −7.25% | +23.60% | 24.83% | 19.91% | 17.75 |
| Tech Mahindra | −6.39% | +8.83% | 16.86% | 17.80% | 19.25 |
| Axis Bank | −5.69% | +8.34% | 8.94% | 13.56% | 20.25 |
| InterGlobe Aviation | −4.78% | −10.91% | 27.95% | 16.52% | 20.25 |
| Larsen & Toubro | −7.04% | +2.76% | 14.35% | 15.32% | 21.00 |
Returns exclude dividends. Annual comparisons account for applicable splits, bonuses and rights issues. Highs and lows are intraday prices. Equal combined scores represent tied positions.
Only four companies in this top 20 rose during September. Yet 18 recorded positive one-year returns.
What stands out in the results
Adani Ports combined a strong month with proximity to its high
Adani Ports led September’s gainers and ended the month just 4.91% below its 52-week high. Its one-year return was 28.13%.
Adani Enterprises ranked second, with a smaller monthly gain of 1.55% and a 65.62% recovery from its yearly low.
Shriram Finance and BSE retained large annual gains
Shriram Finance and BSE had the strongest one-year returns among the top 20, at 59.50% and 51.55%, respectively. Both fell during September.
BSE also ended the month 30.47% below its yearly high. A large annual gain can therefore coexist with a substantial decline from a more recent peak.
An investor who bought a year earlier and one who bought near that peak would have experienced very different outcomes.
Eternal’s recovery had not produced an annual gain
Eternal stood 50.52% above its 52-week low at September-end. However, its price was still 1.69% below its level a year earlier.
A recovery percentage starts from the low, which may be well below an investor’s purchase price. It should not be read as the return earned by everyone holding the stock.
ITC gained during September but missed the combined top 20
ITC gained 2.84% in September, making it one of the month’s five gainers. But it fell outside the combined top 20 when one-year performance and the 52-week price range were also considered.
What the ranking leaves out
All four measures depend on share prices, and some overlap. The combined score summarises past price behaviour; it does not measure earnings growth, debt, cash flow or valuation.
A high-ranking stock may already trade at an expensive valuation. A low-ranking stock may face business difficulties, or its price may have fallen more than its earnings prospects justify. This table cannot establish either conclusion.
For investors reviewing an existing holding, the useful starting point is to match the comparison period to their own investment. September’s return describes one month. Annual returns and distance from the peak add context, but assessing whether to keep holding requires examining the business and the price paid.
Methodology: The stock universe is the Nifty 50 constituent list at September 30, 2026. BSE replaced Wipro effective that date; historical returns relate to the constituent companies even where they predate index entry. Monthly returns use August 31 and September 30, 2026 closing prices. Annual returns use September 30, 2025 and September 30, 2026 closing prices, adjusted where applicable for splits, bonuses and rights issues. The high-low comparison uses NSE’s adjusted 52-week file effective October 1, incorporating September 30 trading. The combined score averages four ranks across the 48 eligible stocks, using unrounded calculations and average ranks for ties. Hindustan Unilever and Tata Motors Passenger Vehicles are excluded from that score because comparable demerger-adjusted histories were not established.
Sources
- NSE stock closing data: September 30, 2026
- NSE stock closing data: August 31, 2026
- NSE stock closing data: September 30, 2025
- NSE index closing data: September 30, 2026
- NSE index closing data: August 31, 2026
- NSE adjusted 52-week high-low data effective October 1, 2026
- NSE circular: BSE’s inclusion in Nifty 50
- NSE circular: Kotak Mahindra Bank share split
- NSE circular: Trent bonus issue
- NSE circular: Adani Enterprises rights-issue adjustment methodology
- NSE closing data for the Adani Enterprises pre-rights adjustment: November 14, 2025
Disclaimer: This article is for information and educational purposes only and does not constitute investment advice or a recommendation to buy or sell any security. The rankings reflect historical price performance and do not assess investment suitability. Past performance does not guarantee future returns. Investments are subject to market risks. Consult a SEBI-registered investment adviser before making investment decisions.