

HDFC Bank: What Must Change to Win Back Investors?
Can HDFC Bank win back investors? Explore how deposit costs, profit margins, loan quality ...
12 October 2026

Finnovate’s editorial team researches and creates financial content using trusted sources, regulatory references and inputs from subject experts.
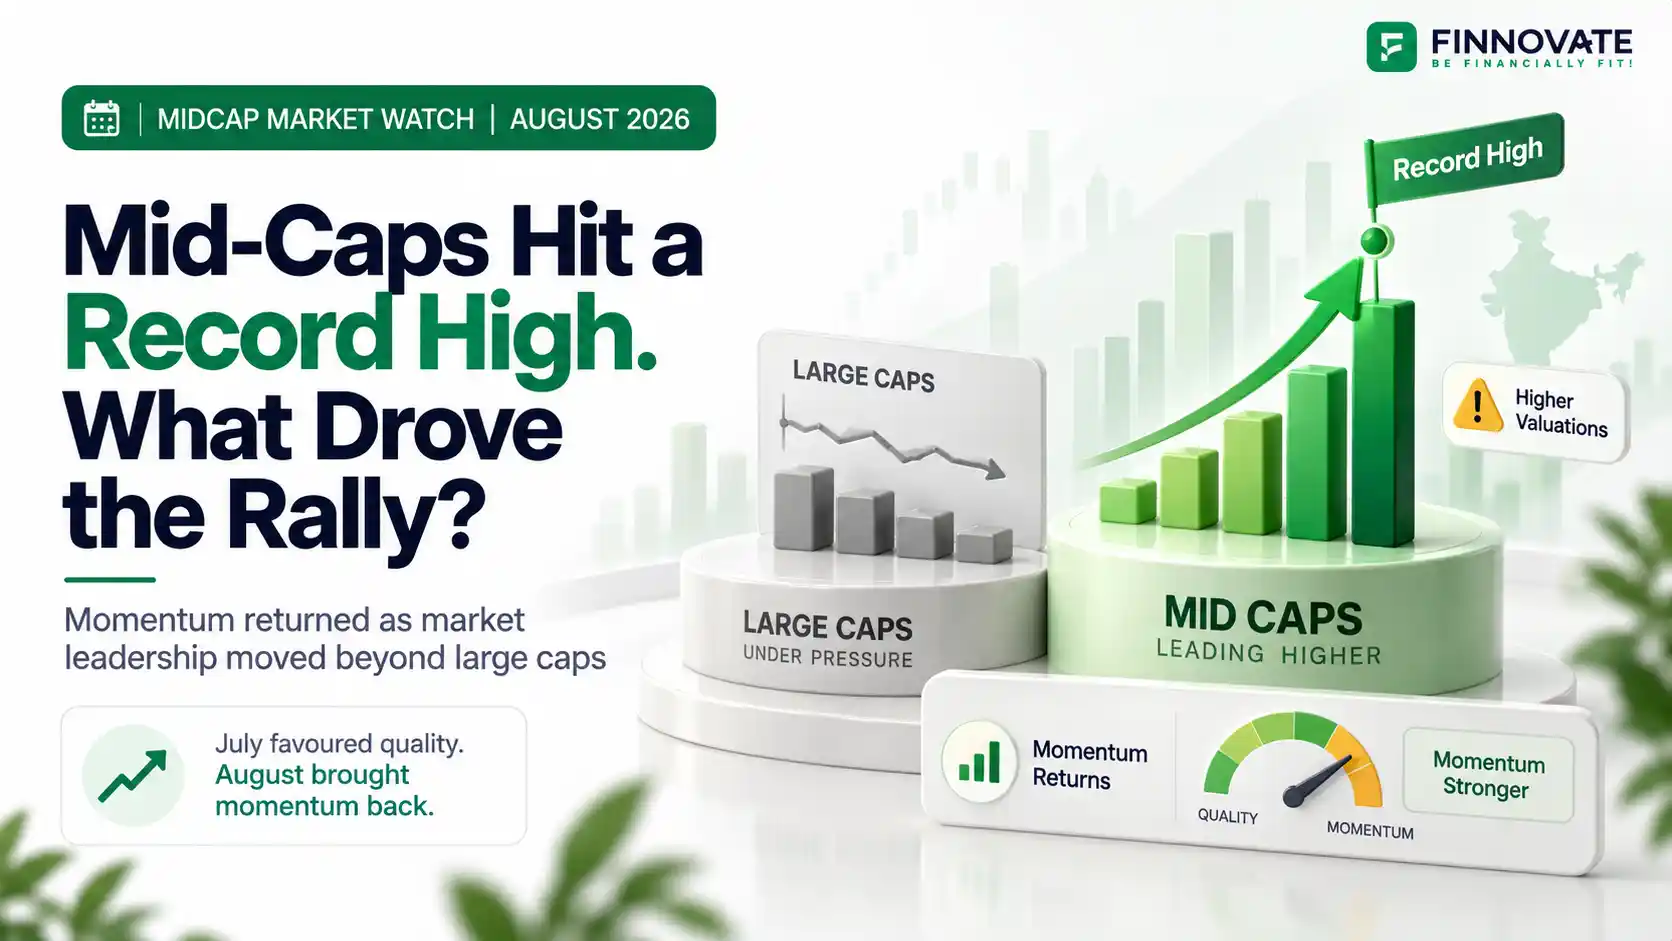
August 2026 produced an unusual split in the Indian stock market.
The Nifty 50 fell 1.14%, but the Nifty Midcap 100 gained 2.15%. Small-caps did even better, while micro-caps rose more than 5% during the month.
The Midcap 100 also touched a record intraday high of 64,450.90 on August 26 and ended the month at 64,224.75, less than 0.4% below that peak.
So August was not simply another month when the entire Indian market moved together.
Large-cap benchmarks struggled. Smaller companies continued to attract money.
And inside mid-caps, another shift was taking place.
That may be the more useful story behind the top-performing mid-cap stocks of August 2026.
Table of Contents
Official NSE Indices data gives a clear picture of the divergence.
| Index | August 2026 Return |
|---|---|
| Nifty 50 | -1.14% |
| Nifty Midcap 100 | +2.15% |
| Nifty Smallcap 100 | +3.16% |
| Nifty Microcap 250 | +5.49% |
| Nifty Midcap150 Momentum 50 | +3.87% |
| Nifty Midcap150 Quality 50 | +0.93% |
These are Total Return Index figures, which include dividends, as published by NSE Indices for the period ended August 31, 2026.
The size pattern itself is interesting.
As you moved down the market-cap spectrum in August, returns generally became stronger.
There is an important measurement issue before looking at individual stocks.
A “one-month return” can mean a rolling 30-day period or a calendar-month return. Those two numbers can be quite different when a stock moves sharply during the first days of September.
For this analysis, we use a simpler and more consistent measure:
These are price returns, so unlike NSE's index figures above, they do not include dividends.
The table below is a selected list of prominent mid-cap performers, not an exhaustive ranking of every Nifty Midcap 100 constituent and not a stock recommendation.
| Company | July 31 Close | August 31 Close | August Return |
|---|---|---|---|
| Paytm | ₹1,343.00 | ₹1,717.10 | +27.86% |
| MCX | ₹2,692.20 | ₹3,400.00 | +26.29% |
| Motilal Oswal Financial Services | ₹851.95 | ₹1,042.90 | +22.41% |
| APL Apollo Tubes | ₹1,819.50 | ₹2,223.40 | +22.20% |
| Lenskart | ₹561.40 | ₹662.40 | +17.99% |
| SAIL | ₹169.03 | ₹195.00 | +15.36% |
| Coforge | ₹1,721.00 | ₹1,985.30 | +15.36% |
| KEI Industries | ₹4,999.00 | ₹5,740.30 | +14.83% |
| Oracle Financial Services Software | ₹11,186.00 | ₹12,540.00 | +12.10% |
| Glenmark Pharmaceuticals | ₹2,233.90 | ₹2,480.00 | +11.02% |
The historical closing prices above were cross-checked from exchange-linked historical price records. Paytm, MCX, Motilal Oswal, APL Apollo and Lenskart all recorded strong double-digit calendar-month gains. SAIL, Coforge, KEI Industries, OFSS and Glenmark also ended August materially higher than their July 31 closing levels.
One more methodological point matters here.
Lenskart listed on the stock exchanges only on November 10, 2025, so it did not have a full one-year trading history by August 2026.
This is one reason a simple calendar-month comparison is more useful for this particular article than forcing every stock into the same multi-period score.
This may be the most interesting change beneath the index.
NSE maintains two separate mid-cap strategy indices.
The Nifty Midcap150 Momentum 50 selects stocks partly on their six-month and 12-month price performance, adjusted for volatility.
The Nifty Midcap150 Quality 50, meanwhile, uses factors including return on equity, financial leverage and stability of earnings growth.
Look at how their relative performance changed:
| Strategy Index | July 2026 | August 2026 |
|---|---|---|
| Midcap150 Momentum 50 | -0.41% | +3.87% |
| Midcap150 Quality 50 | +2.62% | +0.93% |
In July, quality beat momentum by more than three percentage points.
One month later, the relationship reversed.
Momentum beat quality by almost three percentage points in August.
That does not mean every momentum stock beat every quality company, nor does it mean momentum will continue outperforming.
But it tells us something important about what the market rewarded during August.
The individual winners were not coming from a single industry.
Several different market themes were working at the same time.
Official NSE sector indices show some of August's stronger areas:
| Sector / Theme Index | August Return |
|---|---|
| Nifty MidSmall IT & Telecom | +6.60% |
| Nifty Capital Goods | +5.39% |
| Nifty Telecommunications | +4.73% |
| Nifty Metal | +3.77% |
| Nifty Consumer Services | +3.75% |
| Nifty MidSmall Financial Services | +3.24% |
| Nifty Pharma | +2.50% |
These indices are not a direct decomposition of the Nifty Midcap 100, but the pattern helps explain why several different types of mid-cap companies appeared among August's leaders.
Paytm gained nearly 28% during the month, MCX rose more than 26% and Motilal Oswal Financial Services gained over 22%.
Those companies are not identical businesses.
MCX operates an exchange. Motilal Oswal has businesses linked to broking, asset management and wealth. Paytm operates across payments and financial-services distribution.
So it would be too broad to call all of them one “financial inclusion” trade.
The Nifty MidSmall Financial Services index itself gained 3.24% during August.
Coforge rose about 15.4% during August, while Oracle Financial Services Software gained roughly 12.1%.
Vodafone Idea, although outside our selected double-digit table by only a small margin, also rose about 10.2% from July 31 to August 31.
That lines up with broader sector performance.
The broader Nifty Telecommunications index gained 4.73%.
Technology's participation is particularly interesting because the headline Nifty IT index had already risen sharply in July, gaining 17.13%. It still added another 1.59% in August.
So the technology story was not limited to a single one-month rebound.
APL Apollo Tubes gained around 22.2% during the month, while KEI Industries rose roughly 14.8%.
BHEL, another prominent capital-goods name, gained around 8.8% from July 31 to August 31.
The sector backdrop was supportive.
That reversal mirrors the broader momentum story.
Several areas that had struggled or cooled in July found buyers again during August.
SAIL rose approximately 15.4% during August, while National Aluminium gained about 9%.
The Nifty Metal index gained 3.77% during the month and was up 45.64% over one year as of August-end.
That longer-term number is important.
August's metal strength was not happening after a year of weakness. The sector had already experienced a substantial rerating.
Glenmark Pharmaceuticals gained about 11%, while Aurobindo Pharma rose around 8.7% and Laurus Labs roughly 5.4% during the calendar month.
The Nifty Pharma index gained 2.50% during August, while Nifty MidSmall Healthcare rose 1.60%.
Healthcare therefore remained part of the positive mid-cap mix.
But August's strongest relative leadership was more visible in areas such as IT and telecom, capital goods, metals and selected financial businesses.
That distinction matters because looking only at a list of winning stocks can make several sectors appear equally strong when the broader sector indices tell a more nuanced story.
Part of the answer lies in index composition.
The Nifty 50 is heavily influenced by India's biggest companies. Reuters noted that large heavyweight stocks including HDFC Bank and Reliance Industries underperformed during August, while mid-cap and small-cap indices reached record highs.
A few large companies can pull down a market-cap-weighted benchmark even while many stocks elsewhere in the market perform differently.
The backdrop also became somewhat more supportive for equities.
Foreign Portfolio Investors bought approximately $3.1 billion of Indian shares in August, their strongest monthly net buying in nearly two years.
But foreign buying should not be treated as the sole explanation for the mid-cap rally.
FPI flows were selective, domestic investors remain important, company earnings matter and sector rotation can occur independently of headline foreign-flow numbers.
Strong performance does not remove risk.
At August-end, NSE Indices reported:
| Metric | Nifty Midcap 100 | Nifty 50 |
|---|---|---|
| P/E ratio | 30.95 | 20.36 |
| P/B ratio | 4.43 | 2.92 |
| 1-year volatility | 16.30% | 13.24% |
The P/E comparison should not be read mechanically.
The Midcap 100 and Nifty 50 have different sector mixes, earnings profiles and business maturity. A higher P/E does not automatically mean every mid-cap stock is overvalued.
But the numbers still provide useful context.
That becomes more relevant when an index is close to a record high and several recent winners have already delivered strong returns.
A rising share price can make a company's past performance look attractive at exactly the same time that the price being paid for future earnings becomes more demanding.
No.
This is where performance analysis and investment analysis must be separated.
A stock can rank highly because:
None of those automatically tells us whether the stock offers an attractive return from today's price.
A proper investment decision also requires looking at:
That distinction becomes even more important after a strong month.
August ended with the Nifty Midcap 100 near a record high and with momentum strategies outperforming quality.
The next question is whether that leadership can persist.
August reversed July's relationship sharply. One additional month will not establish a durable trend.
IT and telecom, capital goods, metals, consumer services and selected financial businesses all contributed.
With the Midcap 100 trading near 31 times earnings at August-end, future earnings delivery becomes increasingly important.
August's $3.1 billion equity inflow was encouraging, but FPIs remained large net sellers for calendar 2026.
Oil prices, geopolitical developments and global interest rates can change risk appetite quickly.
Early September has already shown that broader-market stocks are not immune to these pressures, with mid- and small-caps slipping as crude prices and geopolitical concerns returned to focus.
The simple answer is that mid-caps remained strong.
But that misses the more interesting change.
The Nifty 50 lost 1.14% in August while the Nifty Midcap 100 gained 2.15% and reached a record high. Smaller market-cap segments performed even better.
At the same time, momentum-oriented mid-caps moved from underperforming quality in July to decisively outperforming it in August.
Several individual stocks delivered double-digit monthly gains, with leadership spread across financial services, capital markets, technology, industrials, metals, consumer businesses and healthcare.
But record prices also raise the hurdle.
Mid-caps ended August trading at a substantially higher headline valuation than the Nifty 50 and with higher historical volatility.
So the question for the coming months is no longer simply:
Can mid-caps rise further?
It is:
The Nifty Midcap 100 returned 2.15% in August 2026 on a Total Return Index basis, according to NSE Indices. It was also up 15.94% over one year as of August 31.
Among prominent names analysed, Paytm gained about 27.9%, MCX 26.3%, Motilal Oswal Financial Services 22.4%, APL Apollo Tubes 22.2% and Lenskart about 18% between July 31 and August 31. These are historical price returns, not investment recommendations.
Yes. The Nifty Midcap 100 gained 2.15% while the Nifty 50 fell 1.14% during August on a Total Return Index basis.
Yes. The Nifty Midcap150 Momentum 50 gained 3.87% in August, while the Nifty Midcap150 Quality 50 gained 0.93%. In July, the opposite had happened, with quality outperforming momentum.
NSE sector indices show strong August performance in MidSmall IT & Telecom, capital goods, telecommunications, metals, consumer services and MidSmall financial services.
The index traded at a P/E ratio of 30.95 at August-end, compared with 20.36 for the Nifty 50. However, direct valuation comparisons should account for differences in sector mix and earnings profiles.
Past performance alone cannot determine whether a stock is attractive to buy. Valuation, earnings, balance-sheet quality, business risks and portfolio suitability also need to be considered.
Disclaimer: This article is for educational and informational purposes only. References to stocks, sectors, historical returns, valuations and market trends are not investment recommendations or advice to buy, sell or hold any security. Past performance does not indicate or guarantee future returns. Investors should evaluate business fundamentals, valuation, portfolio allocation, financial goals and risk profile before making investment decisions.
No spam. Only new posts, simple explainers, and practical money checklists for busy professionals.
Finnovate is a SEBI-registered financial planning firm that helps professionals bring structure and purpose to their money. Over 3,500+ families have trusted our disciplined process to plan their goals - safely, surely, and swiftly.
Our team constantly tracks market trends, policy changes, and investment opportunities like the ones featured in this Weekly Capsule - to help you make informed, confident financial decisions.
Learn more about our approach and how we work with you:
No comments yet. Start the conversation. What would you add?
No spam. Only new posts, simple explainers, and practical money checklists.
You may also like
Can HDFC Bank win back investors? Explore how deposit costs, profit margins, loan quality ...
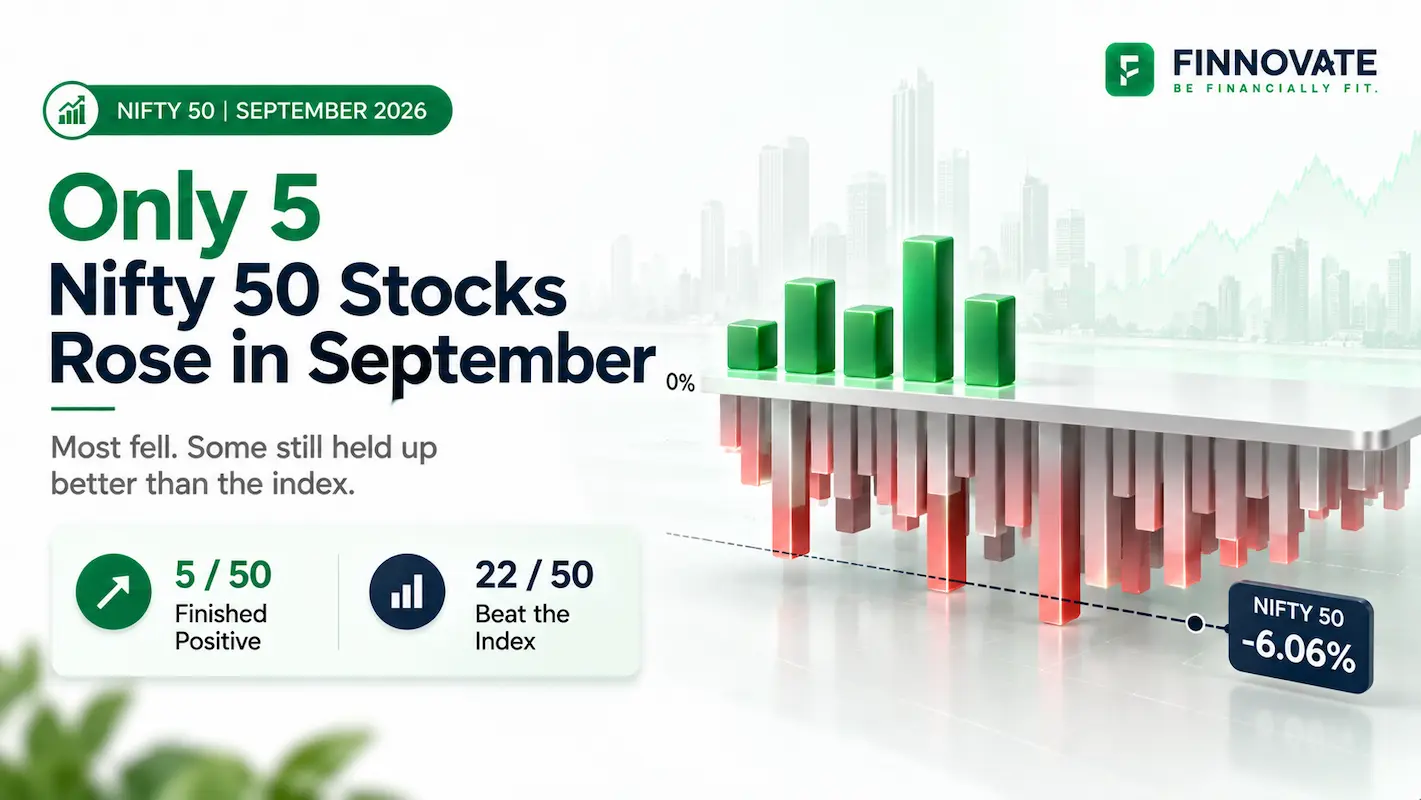
Only five Nifty 50 stocks rose in September 2026 as the index fell 6.06%. Compare monthly ...

Why did hospital stocks fall after Supreme Court scrutiny of medicine prices? Understand d...
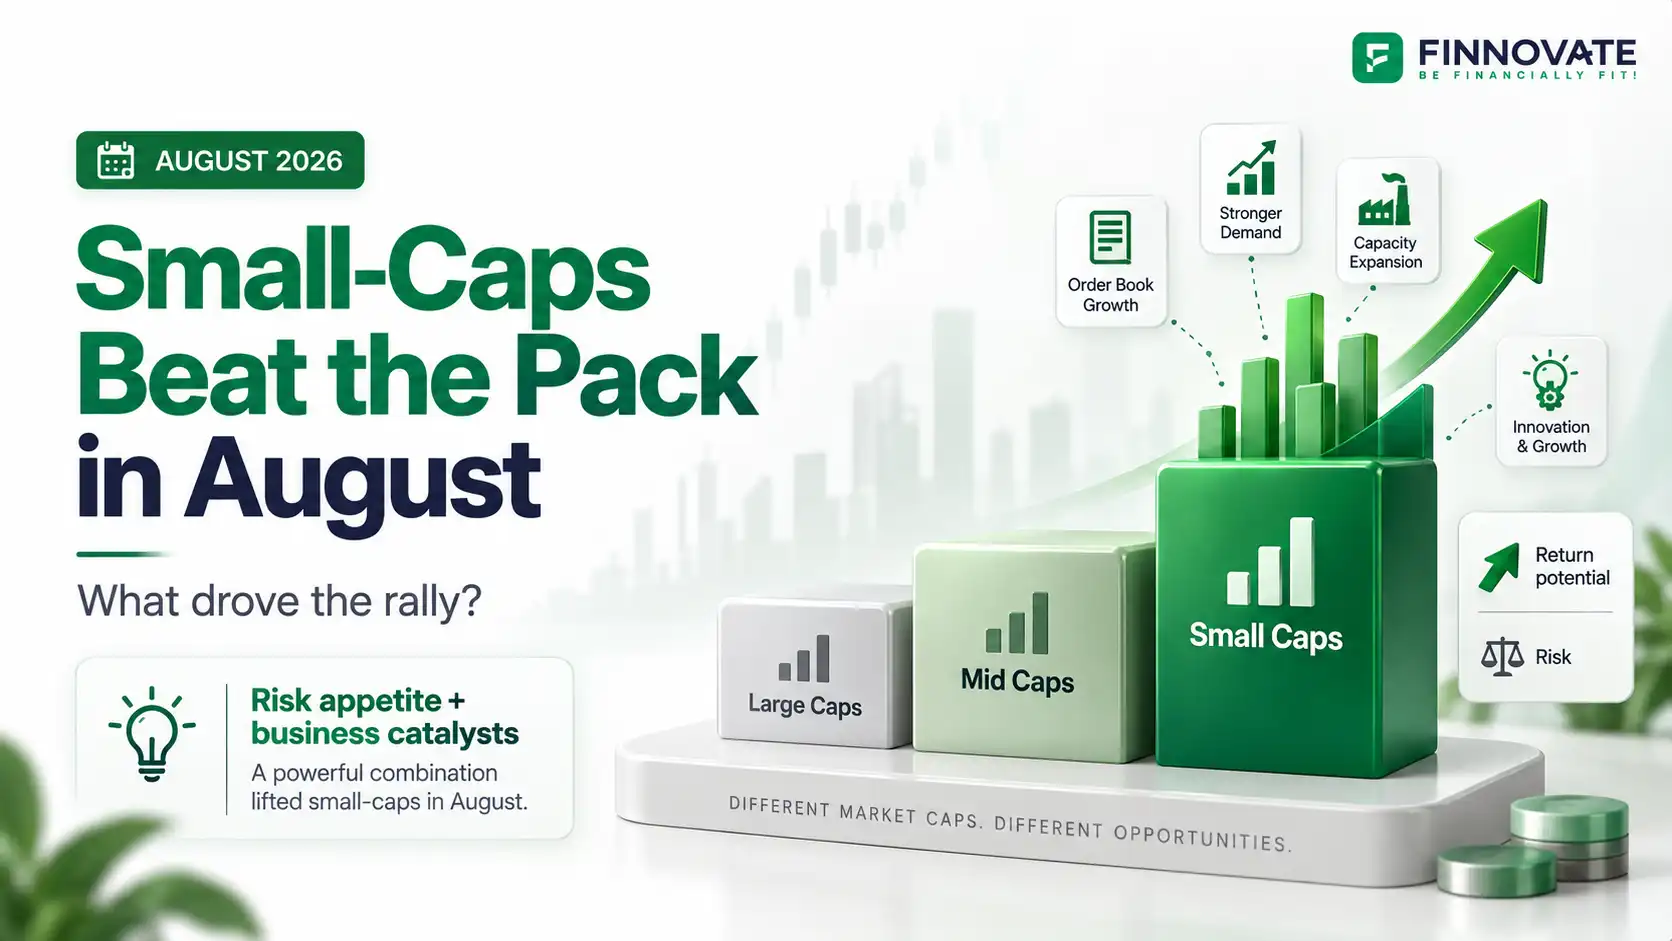
Nifty Smallcap 100 rose 3.16% in August 2026. See which small-cap stocks led, what drove t...
Popular now

Learn how to easily download your NSDL CAS Statement in PDF format with our step-by-step g...

Looking for the best financial freedom books? Here’s a handpicked 2026 reading list with...

Learn what SIF investment means in India, SEBI rules, Rs 10 lakh minimum investment, avail...

Clear guide to mutual fund taxation in India for FY 2025–26 after July 2024 changes: equ...