

India Coal Stocks 2026: Why 39% of Power Plants Are Critically Low
Nearly 39% of India’s monitored coal power plants were critically low on fuel in Septemb...
22 September 2026


Finnovate’s editorial team researches and creates financial content using trusted sources, regulatory references and inputs from subject experts.
Foreign Portfolio Investors returned as net buyers of Indian equities in July 2026 after four consecutive months of selling.
NSDL sectoral data shows net equity buying of approximately $2.10 billion during the month. Consumer services, healthcare and consumer durables attracted the largest inflows, while capital goods, telecom and automobiles recorded the heaviest selling.
The more useful question is whether the factors that brought FPIs back can continue.
Table of Contents
| Indicator | July 2026 position |
|---|---|
| Net FPI equity flow | $2.10 billion |
| Sectors with net buying | 13 |
| Sectors with net selling | 10 |
| Largest buying sector | Consumer services |
| Largest selling sector | Capital goods |
| Net FPI debt flow | Around $2.0 billion |
| FY27 equity flow through July | Net selling of about $27.16 billion |
| FY27 debt flow through July | Net buying of about $8.57 billion |
The sector pattern was selective rather than broad.
| Sector | Net FPI flow |
|---|---|
| Consumer services | $1,063 million |
| Healthcare | $809 million |
| Consumer durables | $768 million |
| Metals and mining | $512 million |
| Information technology | $352 million |
| Construction materials | $254 million |
| Services | $250 million |
| Realty | $186 million |
Consumer services alone received more than half of July’s total net equity inflow.
| Sector | Net FPI flow |
|---|---|
| Capital goods | -$655 million |
| Telecommunication | -$598 million |
| Automobiles and components | -$472 million |
| Power | -$299 million |
| Construction | -$126 million |
| Financial services | -$74 million |
| FMCG | -$65 million |
Capital goods, telecom and automobiles together recorded net selling of about $1.73 billion.
Consumer services received net inflows of approximately $1.06 billion.
Hospitality, retail and restaurant businesses depend more on Indian demand than on global trade or overseas capital spending.
Travel, urbanisation, organised retail and rising incomes can support long-term demand.
Many consumer-service businesses are less exposed to the timing of heavy industrial projects.
Food inflation, wages, rentals and weaker discretionary spending can still affect margins.
Healthcare was the second-largest recipient of foreign buying.
Consumer durables received net buying of about $768 million.
The category contains both consumer brands and contract manufacturers. Their growth drivers, margins and capital requirements can differ substantially.
Metals and mining received $512 million, while construction materials attracted $254 million.
Metal prices, Chinese demand, tariffs, energy costs and currency movements can change sector earnings rapidly. One month of buying should not be treated as a permanent preference.
Information technology received net FPI buying of approximately $352 million after a difficult period for the sector.
Capital goods and power recorded combined net selling of approximately $954 million.
The selling does not necessarily mean India’s investment cycle has ended. It may also reflect profit-taking or a shift towards sectors with more immediate earnings visibility.
Telecom and automobiles together recorded selling of roughly $1.07 billion.
| Asset class | FPI flow through July 2026 |
|---|---|
| Indian equities | Net selling of about $27.16 billion |
| Indian debt | Net buying of about $8.57 billion |
Policy changes improved the post-tax appeal of eligible Indian government securities for overseas investors.
Foreign-currency deposits placed with Indian banks, mainly by non-resident Indians.
Investments by registered overseas portfolio investors in Indian securities.
Not yet.
FPIs compare India with the US, China, Taiwan, South Korea and other emerging markets. Strong domestic growth alone does not guarantee sustained inflows.
| Indicator | Why it matters |
|---|---|
| Monthly equity flow | Shows whether July’s buying continues |
| Sectoral breadth | Reveals whether demand spreads beyond a few sectors |
| FPI debt flow | Shows overseas demand for Indian fixed income |
| Rupee movement | Affects dollar returns for foreign investors |
| Crude-oil price | Influences inflation and India’s external balance |
| US Treasury yields | Affect the relative appeal of emerging-market assets |
| Corporate earnings | Determine whether valuations are supported |
| FPI assets under custody | Shows the longer-term foreign-ownership trend |
July 2026 marked a meaningful change in foreign-investor behaviour.
FPIs returned as net buyers, with strong demand for consumer services, healthcare and consumer durables. IT also attracted buying, while capital goods, telecom and automobiles remained under pressure.
At the same time, foreign demand for Indian government bonds benefited from a more favourable tax and regulatory environment.
But July did not erase the larger FY27 equity outflow.
NSDL sectoral data showed net equity buying of approximately $2.10 billion during July.
Consumer services received the largest net inflow at approximately $1.06 billion.
Capital goods, telecom and automobiles recorded the largest net outflows.
No. July was positive, but cumulative FY27 equity flows remained heavily negative and buying was concentrated in selected sectors.
Tax and regulatory changes improved the post-tax attractiveness of eligible government securities, while yields, currency expectations and index inclusion also supported demand.
No direct link has been established. FCNR(B) inflows may have supported reserves, the rupee and wider confidence, but they are separate from FPI equity flows.
Key indicators include monthly equity flows, sectoral breadth, debt flows, crude oil, the rupee, US bond yields, corporate earnings and FPI assets under custody.
Disclaimer: This article is for general information and educational purposes only. It does not constitute investment advice or a recommendation regarding any sector, company, security or asset class. FPI data may vary by source, reporting date, transaction category and currency conversion.
No spam. Only new posts, simple explainers, and practical money checklists for busy professionals.
Finnovate is a SEBI-registered financial planning firm that helps professionals bring structure and purpose to their money. Over 3,500+ families have trusted our disciplined process to plan their goals - safely, surely, and swiftly.
Our team constantly tracks market trends, policy changes, and investment opportunities like the ones featured in this Weekly Capsule - to help you make informed, confident financial decisions.
Learn more about our approach and how we work with you:
No comments yet. Start the conversation. What would you add?
No spam. Only new posts, simple explainers, and practical money checklists.
You may also like
Nearly 39% of India’s monitored coal power plants were critically low on fuel in Septemb...

Tata Sons faces a major governance dispute over N Chandrasekaran’s reappointment, RBI li...
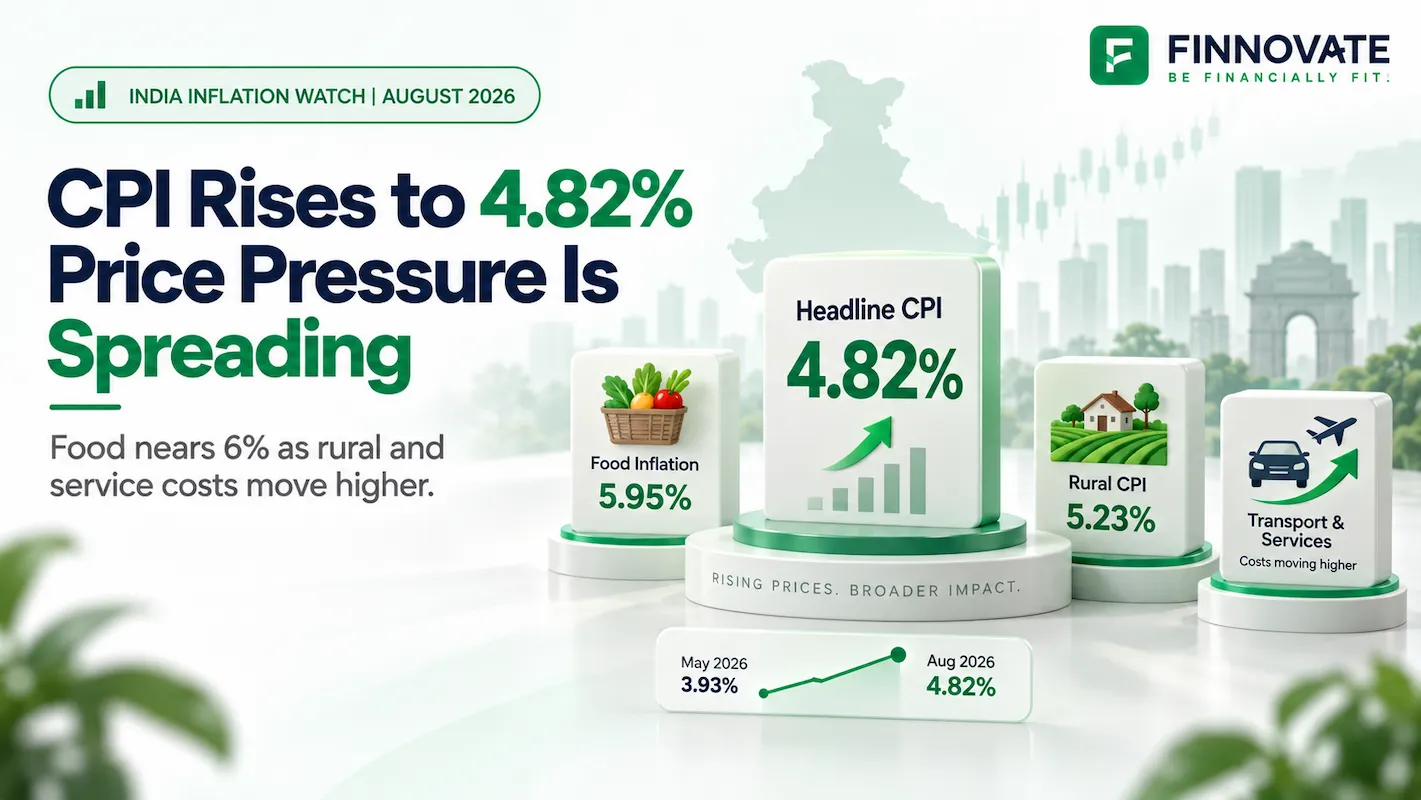
India’s CPI inflation rose to 4.82% in August 2026 as food inflation neared 6% and rural...
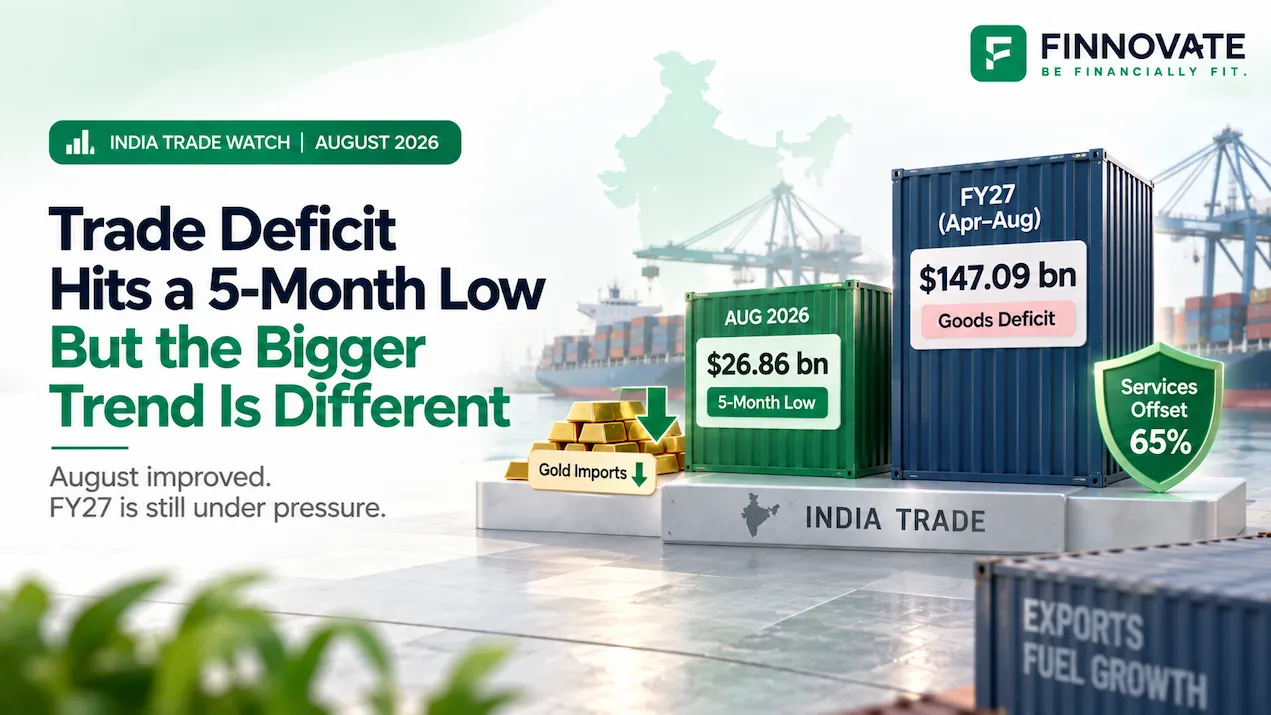
India’s trade deficit narrowed to $26.86 billion in August 2026. See what drove the impr...
Popular now

Learn how to easily download your NSDL CAS Statement in PDF format with our step-by-step g...

Looking for the best financial freedom books? Here’s a handpicked 2026 reading list with...

Learn what SIF investment means in India, SEBI rules, Rs 10 lakh minimum investment, avail...

Clear guide to mutual fund taxation in India for FY 2025–26 after July 2024 changes: equ...