

India–Mauritius Tax Treaty: Principal Purpose Test Explained
Understand the India–Mauritius tax treaty’s Principal Purpose Test, its August 2026 ef...
22 October 2026


Finnovate’s editorial team researches and creates financial content using trusted sources, regulatory references and inputs from subject experts.
Foreign portfolio investors (FPIs) recorded net equity outflows of ₹47,955 crore during October 1–15, 2026, equivalent to about $5.04 billion.
Selling more than doubled from the preceding fortnight and spread across 18 of the 23 equity categories in the sector report. Financial services saw the largest outflow, followed by FMCG, automobiles and healthcare.
Information technology stood out on the buying side, attracting ₹2,599 crore. Four other categories also received net inflows, though the amounts were much smaller.
The first half of October therefore extended September’s selling trend, with sharper withdrawals from several large sectors and buying concentrated in a handful of categories.
Net equity outflows increased across three consecutive reporting periods.
| Reporting period | Net FPI equity flows, ₹ crore |
|---|---|
| September 1–15, 2026 | −14,116 |
| September 16–30, 2026 | −21,745 |
| October 1–15, 2026 | −47,955 |
↔ Scroll horizontally to view the full table.
October’s first-fortnight outflow was 2.21 times the amount recorded during September 16–30, an increase of 120.53%.
It also exceeded the combined outflow across September’s two fortnights. Those fortnightly figures totalled ₹35,861 crore, compared with ₹47,955 crore in the first half of October alone.
The change was visible across sectors. FMCG selling increased sharply, automobiles faced larger withdrawals, and healthcare moved from a marginal net inflow to substantial net selling.
The table is arranged from the largest October net outflow to the largest net inflow.
| Sector | September 16–30, ₹ crore | October 1–15, ₹ crore | October 1–15, US$ million |
|---|---|---|---|
| Financial Services | −6,943 | −8,634 | −908 |
| Fast Moving Consumer Goods | −972 | −8,172 | −860 |
| Automobile and Auto Components | −3,542 | −6,533 | −687 |
| Healthcare | +3 | −5,497 | −578 |
| Telecommunication | −2,423 | −3,928 | −413 |
| Capital Goods | −1,353 | −3,886 | −409 |
| Metals & Mining | −2,322 | −3,693 | −388 |
| Oil, Gas & Consumable Fuels | −4,469 | −3,680 | −387 |
| Consumer Services | +1,911 | −1,931 | −203 |
| Power | −570 | −1,732 | −182 |
| Construction | +381 | −1,224 | −129 |
| Consumer Durables | −1,508 | −586 | −62 |
| Realty | +19 | −578 | −61 |
| Construction Materials | −847 | −564 | −59 |
| Others | −1,091 | −372 | −39 |
| Textiles | +636 | −59 | −6 |
| Forest Materials | +6 | −50 | −5 |
| Utilities | −33 | −34 | −4 |
| Chemicals | −133 | +41 | +4 |
| Diversified | +115 | +43 | +5 |
| Media, Entertainment & Publication | +31 | +252 | +27 |
| Services | +1,397 | +262 | +28 |
| Information Technology | −38 | +2,599 | +273 |
| Total | −21,745 | −47,955 | −5,044 |
↔ Scroll horizontally to view the full table.
Source: Official fortnightly sector-wise FPI investment report. The rounded October 1–15 sector rows total −₹47,956 crore and −$5,043 million; the published totals are −₹47,955 crore and −$5,044 million.
Financial services recorded net selling of ₹8,634 crore, up from ₹6,943 crore in the previous fortnight.
FMCG followed closely at ₹8,172 crore, compared with ₹972 crore during September 16–30. Its outflow increased by ₹7,200 crore, the largest deterioration among the categories in the table.
Automobile and auto-component outflows rose from ₹3,542 crore to ₹6,533 crore. Healthcare, which had received a small ₹3 crore net inflow in the preceding fortnight, recorded ₹5,497 crore in net selling.
Together, these four categories accounted for ₹28,836 crore of net selling.
The absolute amounts show where the largest withdrawals occurred. Comparing them with the size of existing holdings adds another perspective.
Financial-services selling was approximately 0.43% of its September 30 equity AUC. FMCG selling was approximately 2.98% of its opening equity AUC. Financial services led in rupee terms, while FMCG saw a larger withdrawal relative to the value of holdings at the start of the fortnight.
These percentages compare flows with opening holdings; they are not measures of investment returns.
Healthcare was part of a wider shift.
Consumer services moved from ₹1,911 crore of net buying to ₹1,931 crore of net selling. Construction shifted from a ₹381 crore inflow to a ₹1,224 crore outflow.
Realty, textiles and forest materials also moved from positive to negative flows.
Selling intensified in telecommunications, capital goods, metals and power. However, the pattern varied across categories. Outflows eased in oil, gas and consumable fuels, consumer durables, construction materials and “Others”.
The overall increase in selling therefore reflected both larger withdrawals from existing outflow categories and a reversal in several categories that had previously attracted money.
Information technology received ₹2,599 crore, reversing a small ₹38 crore outflow in the previous fortnight.
The other categories with positive flows were:
Together, the five positive-flow categories received ₹3,197 crore. IT accounted for approximately 81.3% of that amount.
That concentration matters. Buying was spread across five categories, but IT attracted most of the money. Services remained positive, although its inflow fell from ₹1,397 crore in the preceding fortnight to ₹262 crore.
The figures show a strong preference for IT within that fortnight’s positive flows. Establishing whether it becomes a sustained allocation trend requires subsequent reporting periods.
FPI equity holdings were worth $693.641 billion on October 15, compared with $689.409 billion on September 30.
That was an increase of 0.61%, even as FPIs recorded substantial net selling.
| AUC measure | September 30, 2026 | October 15, 2026 | Change |
|---|---|---|---|
| Equity AUC, ₹ crore | 66,17,164 | 65,94,378 | −0.34% |
| Equity AUC, US$ billion | 689.409 | 693.641 | +0.61% |
| Total AUC across reported asset categories, US$ billion | 767.521 | 772.781 | +0.69% |
↔ Scroll horizontally to view the full table.
Flows measure transactions over a period. AUC measures the value of holdings on a date.
The value of those holdings changes with market prices, currency conversion and other portfolio changes, as well as purchases and sales.
In this fortnight, equity AUC fell slightly in rupee terms but rose when expressed in dollars. The change in the report’s conversion rate supported the dollar value.
Financial services provides another example. FPIs sold a net ₹8,634 crore, yet the rupee value of their holdings in the category increased from ₹20,01,020 crore to ₹20,35,663 crore. Changes in the value and composition of holdings can offset the effect of net sales.
Total AUC also includes debt, hybrid holdings, mutual funds and AIFs alongside equity. Its movement reflects developments across all those reported categories.
October opened with much heavier FPI equity selling than either September fortnight. Financial services and FMCG led the withdrawals, while several previously positive categories moved into outflows.
Buying remained selective, with IT receiving most of the money entering positive-flow categories.
For investors tracking the next release, three developments will matter: whether overall selling slows, whether buying extends beyond IT, and whether the categories that turned negative return to inflows. Together, those changes will show whether October’s pattern persists.
FPIs recorded net equity selling of ₹47,955 crore, equivalent to $5,044 million, or approximately $5.04 billion, in the official fortnightly sector report.
Financial services recorded the largest net outflow at ₹8,634 crore. FMCG followed at ₹8,172 crore, ahead of automobiles and healthcare.
Information technology, services, media and entertainment, diversified, and chemicals recorded net inflows. IT led with ₹2,599 crore.
AUC reflects the value of holdings at a particular date. Market-price changes, currency movements and other portfolio changes can lift that value even when sales exceed purchases during the period.
Disclaimer: This article is for information and education only and does not constitute investment advice or a recommendation to buy or sell any security, sector or fund. FPI flows can change quickly and should be assessed alongside fundamentals, valuations, risks and your financial goals.
No spam. Only new posts, simple explainers, and practical money checklists for busy professionals.
Finnovate is a SEBI-registered financial planning firm that helps professionals bring structure and purpose to their money. Over 3,500+ families have trusted our disciplined process to plan their goals - safely, surely, and swiftly.
Our team constantly tracks market trends, policy changes, and investment opportunities like the ones featured in this Weekly Capsule - to help you make informed, confident financial decisions.
Learn more about our approach and how we work with you:
No comments yet. Start the conversation. What would you add?
No spam. Only new posts, simple explainers, and practical money checklists.
You may also like
Understand the India–Mauritius tax treaty’s Principal Purpose Test, its August 2026 ef...

Explore India’s AI hardware opportunity through the proposed Adani–Jabil venture, from...
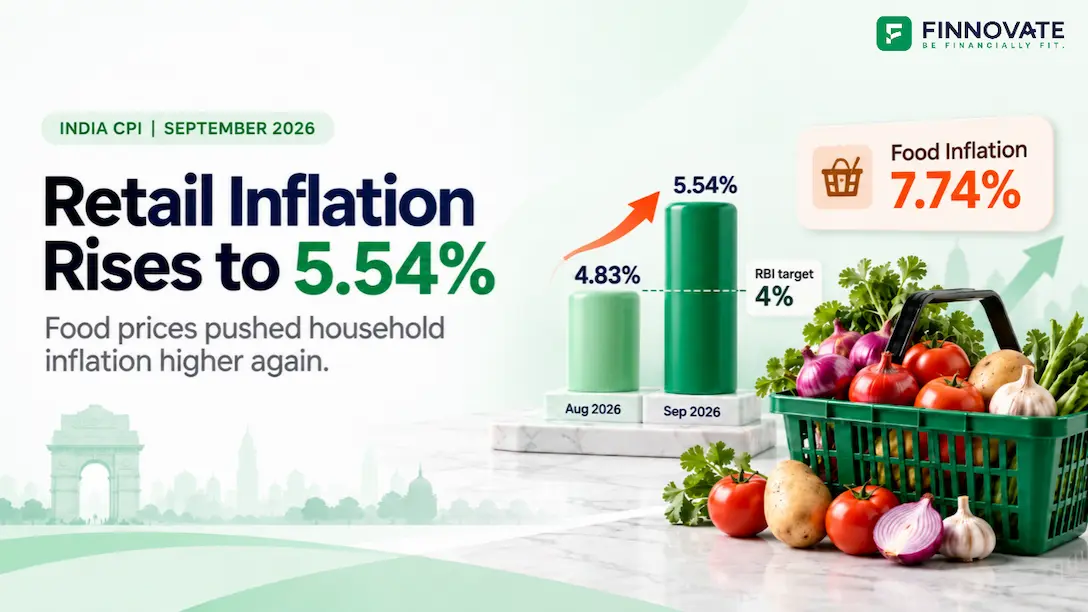
India’s CPI inflation rose to 5.54% in September 2026. Compare monthly trends, food pric...

The Shiller CAPE ratio is near its 1999 peak. Explore what it means for US stock valuation...
Popular now

Learn how to easily download your NSDL CAS Statement in PDF format with our step-by-step g...

Looking for the best financial freedom books? Here’s a handpicked 2026 reading list with...

Learn what SIF investment means in India, SEBI rules, Rs 10 lakh minimum investment, avail...

Clear guide to mutual fund taxation in India for FY 2025–26 after July 2024 changes: equ...