The US Stock Market Is Almost as Expensive as in 1999. Is Another Crash Coming?

Finnovate’s editorial team researches and creates financial content using trusted sources, regulatory references and inputs from subject experts.
In 1999, the internet was going to change everything. Investors were so sure of it that they began paying extraordinary prices for technology stocks. The internet did change the world. But the price of that optimism eventually proved costly.
More than 26 years later, a closely watched measure of US stock market valuations is nearing the same territory.
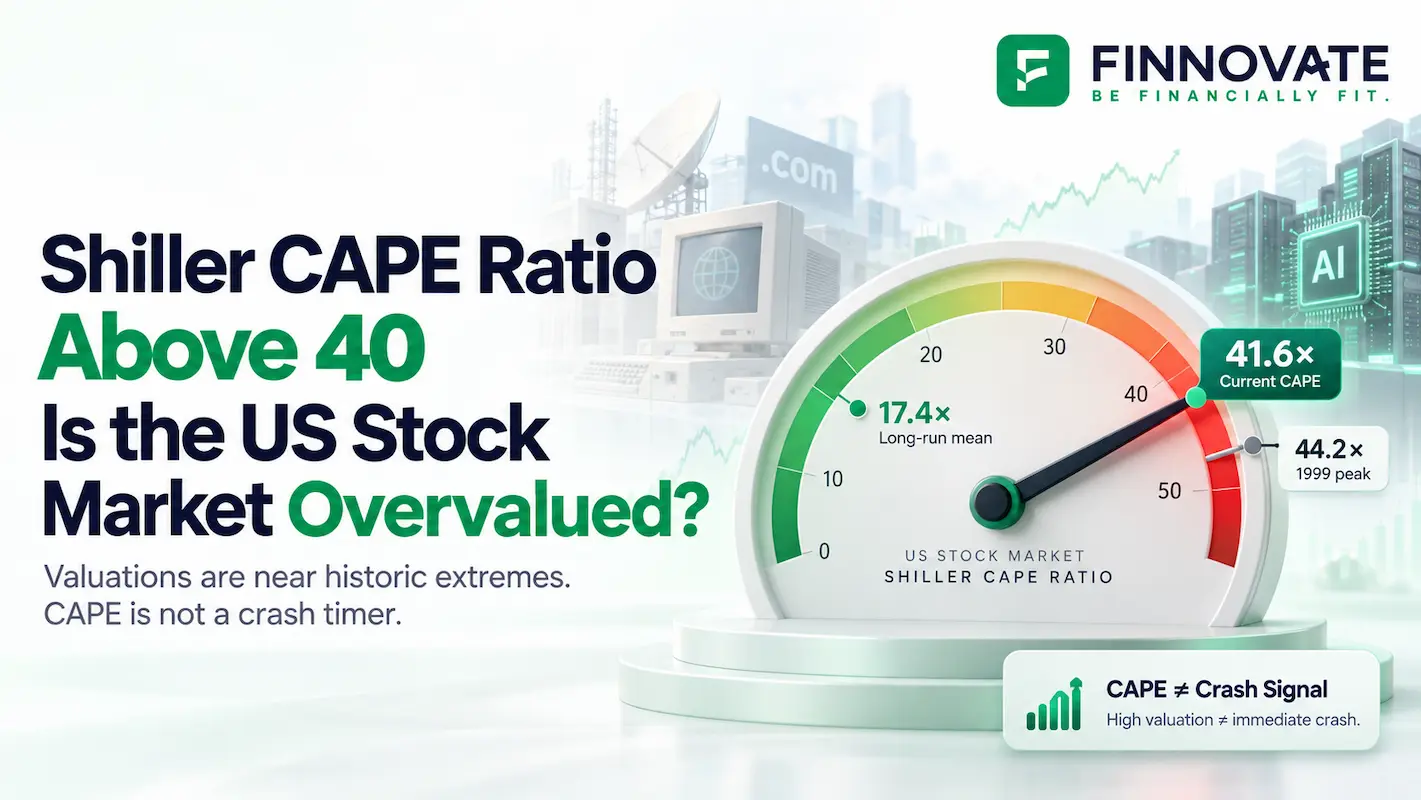
On 8 October 2026, the Shiller CAPE ratio stood at 41.62, according to a daily estimate published by Multpl. Its historical monthly peak was 44.19 in December 1999, near the height of the dot-com boom.
This time, investors are betting on artificial intelligence. And unlike many internet businesses that attracted attention in the late 1990s, today's biggest technology companies already make enormous profits.
So is a familiar valuation warning telling us that another crash is coming? Or are today's high prices more defensible?
Source: Multpl's Shiller CAPE tracker, based on Robert Shiller's data. Daily estimates and monthly observations use different dates and should not be treated as identical measures.
What does a Shiller CAPE ratio above 40 mean?
Imagine two businesses that each earn ₹1 lakh a year. One is available for ₹10 lakh. The other costs ₹40 lakh. Even before looking at their growth prospects, you'd recognise that the second business comes with much higher expectations.
That's the basic idea behind the price-to-earnings, or P/E, ratio. It compares what investors pay for a company with what the company earns.
But a single year's profits can be misleading. Earnings may jump during an economic boom or fall sharply during a recession. A regular P/E ratio can therefore make a business look cheap or expensive for reasons that won't last.
The Shiller CAPE ratio, short for Cyclically Adjusted Price-to-Earnings ratio, uses the average of the previous ten years' inflation-adjusted earnings instead of just one year's profits.
In simple terms: A CAPE of 40 means investors are paying about $40 for each $1 of average annual inflation-adjusted earnings generated over the preceding decade. It is a valuation measure, not a promise of future returns.
In October 2026, the monthly CAPE reading was 41.07. That's more than twice the long-run mean of 17.42. The historical average isn't automatically the right valuation for today's economy, but it tells us how unusual the current level is.
Historical monthly readings: Multpl, Shiller CAPE by month. The October 2026 monthly point is 41.07, distinct from the 8 October daily estimate of 41.62.
A number above 40 is rare. But rarity alone doesn't explain what might happen next. For that, it helps to go back to the last time investors paid similarly high prices.
The last time investors paid this much
By the late 1990s, the internet had become the defining business story of the decade. New websites appeared almost daily. Companies spent heavily on telecom networks and digital infrastructure. Investors expected entire industries to move online.
That expectation wasn't wrong. Shopping, advertising, communication and commerce did move online. But a remarkable technological change doesn't guarantee that every business built around it will succeed.
Some dot-com companies had limited revenue and no sustainable profits. Yet their share prices assumed years of extraordinary growth. Established technology companies were swept up in the enthusiasm too.
When investors started questioning those expectations, the Nasdaq Composite fell sharply between 2000 and 2002. Many internet companies disappeared, while even viable technology businesses lost substantial market value.
The internet survived. Many of the prices paid for internet stocks did not.
It is tempting to take that history and draw a straight line to 2026. But the businesses driving today's market are very different.
The AI boom resembles 1999, but the companies do not
There's a familiar pattern today. A new technology promises to change how businesses work. Companies race to build the infrastructure needed to support it. Investors reward those they expect to benefit most.
In the 1990s, the spending went into telecom cables, servers and internet businesses. Today, it goes into AI chips, data centres, computing systems and software.
But today's biggest technology firms are not simply waiting for their first profitable product.
For the quarter ended June 2026, Microsoft reported $90 billion in revenue and $35.8 billion in net income. Those are profits from an established collection of businesses, including cloud, software and services. The figures are not AI-only earnings.
Alphabet, meanwhile, reported $80.6 billion in capital expenditure during the first six months of 2026, compared with $39.6 billion in the same period of 2025. It said it was investing substantially more in technical infrastructure, including servers and data centres.
This is where the story gets more complicated. AI demand can be real, and the companies serving it can be profitable, while investors still overestimate how much additional profit their next round of investment will generate.
A new data centre takes money to build and maintain. It must then attract enough paying demand. Competition can also reduce the prices companies charge for AI products, even as usage rises.
So the key question isn't whether AI will matter. It's whether the extra earnings created by AI will be large enough to justify the prices investors are paying today.
| The comparison | Dot-com era | AI era |
|---|---|---|
| Big idea | Internet adoption and connectivity | AI software and computing capacity |
| Who attracted capital? | Profitable tech leaders alongside many speculative internet businesses | Large profitable platforms alongside newer AI firms |
| Where the money went | Telecom networks, servers, websites and online businesses | AI chips, data centres, computing infrastructure and applications |
| Critical test | Could internet adoption produce lasting profits? | Can AI-related spending produce enough additional cash flow and profit? |
Why a handful of companies now matter so much
There is another reason this valuation debate matters beyond technology stocks themselves.
Investors often think of the S&P 500 as a diversified collection of major American companies. And it is broad in the number of businesses represented. But it is weighted by market capitalisation, meaning the biggest companies have the greatest influence over the index.
According to S&P Dow Jones Indices, the ten largest constituents made up 37.8% of the S&P 500's weight as of 31 August 2026.
Source: S&P Dow Jones Indices, index characteristics as of 31 August 2026.
Put another way, roughly ₹38 of every ₹100 tracking the index was exposed to its ten biggest constituents at that point, ignoring tracking costs and small differences between funds.
Several of these large businesses are central to the AI boom. If their growth exceeds expectations, they can lift the whole index. If investors become disappointed, their size can also magnify the impact of falling prices.
A broad index can therefore look healthy while becoming increasingly sensitive to a relatively small group of companies.
High valuations also face competition from bonds
After the 2008 financial crisis, US interest rates remained low for long periods. With government bonds offering relatively little income, investors had stronger reasons to consider equities, including companies expected to generate profits far into the future.
October 2026 looks different.
On 8 October, the US Treasury's 30-year inflation-protected Treasury yield was 3.31%. The conventional 30-year Treasury yield stood at 5.60%. These are different measures: one is a real yield derived from inflation-protected securities, while the other is a nominal yield.
Higher bond yields matter because investors have alternatives. They also make future profits less valuable in today's money when those profits are discounted at higher rates.
That is especially important for shares whose prices rely on very strong earnings many years from now.
But we need to avoid a common mistake here.
Dividing 100 by the current CAPE reading of 41.62 gives about 2.40%. This is the cyclically adjusted earnings yield. It is not the S&P 500's dividend yield or a forecast of the return an investor will earn.
Comparing that 2.40% directly with a 30-year bond yield cannot tell us whether a crash is likely or whether stocks are safe.
The more defensible conclusion is simpler: when real bond yields are relatively high, investors need stronger reasons to pay premium valuations for stocks.
Can a CAPE above 40 predict the next crash?
No. At least not by itself.
Research has found that high CAPE ratios tend to be associated with lower inflation-adjusted equity returns over longer periods, particularly horizons around ten years. That does not mean a high reading can predict next month's market movement.
A market can remain expensive for years. Prices might fall, earnings might catch up, or a mix of the two could gradually bring valuations back toward more normal levels.
There is also a genuine debate about how much weight investors should place on a ratio built around accounting earnings.
In June 2026, the Federal Reserve Bank of Minneapolis discussed research suggesting that US corporate valuations look less extreme when measured against broader free cash flow, rather than only reported earnings. The research considered the US corporate sector, including public and private businesses, so it should not be treated as a direct alternative CAPE reading for the S&P 500.
It does, however, make an important point. The way corporations invest, report earnings and return money to owners has changed. A simple comparison with valuations from decades ago may miss part of that evolution.
It would be a mistake to dismiss CAPE entirely. It would be just as mistaken to treat it as a timer counting down to the next crash.
So, is Wall Street repeating the mistake of 1999?
The warning signs deserve attention. US stocks are expensive by a long-standing historical measure. Market performance depends heavily on a small group of large companies. And expectations around AI now need to translate into enough lasting profits to support large investments and high share prices.
But 2026 is not 1999 replayed with new company names. Today's biggest technology companies have established customers, substantial revenues and sizeable profits. Those differences matter.
There are several ways the next few years could unfold. Profits might grow into today's valuations. Investors might become less willing to pay high multiples, causing prices to fall even while earnings remain healthy. Or both could happen in different parts of the market.
The Shiller CAPE ratio does not tell us which outcome will arrive, or when.
It tells us how much investors are already paying for the earnings businesses have demonstrated over the past decade.
And when that price is close to a historical peak, the distinction between a great business and a great investment becomes especially important.
Sources and methodology
- Robert Shiller, historical stock market data, for CAPE definition and long-term historical series.
- Multpl, daily Shiller CAPE tracker, for the 8 October 2026 estimate of 41.62 and long-run summary statistics; monthly series for historical observations.
- Microsoft, Q4 FY2026 earnings release, 29 July 2026.
- Alphabet, 2026 second-quarter SEC filing, for capital expenditure data.
- S&P Dow Jones Indices, S&P 500 index characteristics, as of 31 August 2026.
- US Department of the Treasury, daily interest rates, 8 October 2026.
- Federal Reserve Bank of San Francisco, CAPE and long-term returns.
- Federal Reserve Bank of Minneapolis, June 2026 analysis of valuations and free cash flow.
Disclaimer: This article is for general educational purposes. It explains market valuations and does not constitute a recommendation to buy, sell or time any investment. Historical valuation levels and returns do not guarantee future outcomes.