

ETF & Index Fund Flows September 2026: Data and Rankings
Explore September 2026 ETF and index fund flows, with category-wise inflows, outflows, AUM...
16 October 2026

Finnovate’s editorial team researches and creates financial content using trusted sources, regulatory references and inputs from subject experts.
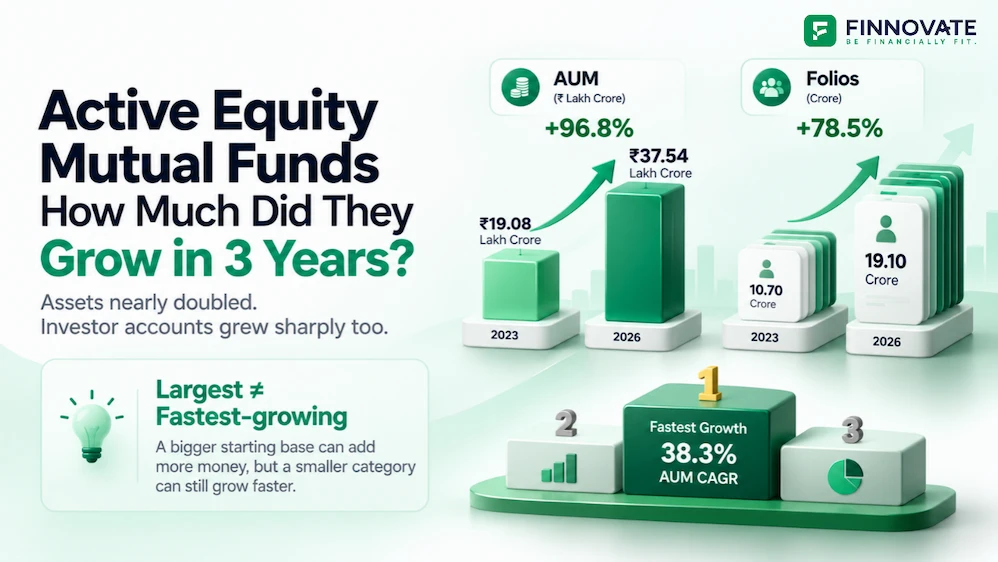
India’s active equity mutual funds nearly doubled their assets under management between September 2023 and September 2026.
AUM rose from ₹19.08 lakh crore to ₹37.54 lakh crore, an increase of 96.76%. Over the same period, folios grew from 10.70 crore to 19.10 crore, an increase of 78.54%.
That translates into three-year compound annual growth rates of 25.31% for AUM and 21.31% for folios. Multi-cap funds led both measures, followed by the combined sectoral and thematic group.
The two measures answer different questions. AUM shows the value of assets managed by a category. Folios show the number of investment accounts. Together, they help compare how categories have expanded in both size and account count.
Let’s use a combined score to compare growth across categories:
The comparison covers open-ended active equity categories. Index funds, ETFs, hybrid funds and closed-ended equity schemes are outside this table.
The score measures category expansion over the period. It is an analytical calculation for this comparison, rather than an AMFI fund rating.
AUM figures are in ₹ crore. Folios are account counts. The table is arranged by combined score.
| Equity fund category | Sep 2023 AUM | Sep 2026 AUM | AUM CAGR | Sep 2023 folios | Sep 2026 folios | Folio CAGR | Combined score |
|---|---|---|---|---|---|---|---|
| Multi-cap | 93,756.74 | 2,48,188.16 | 38.33% | 48,31,118 | 1,20,74,365 | 35.71% | 1.00 |
| Sectoral / thematic | 2,20,141.61 | 5,46,856.28 | 35.43% | 1,43,15,827 | 3,31,88,556 | 32.35% | 2.00 |
| Small-cap | 1,98,483.22 | 4,61,751.59 | 32.50% | 1,46,84,798 | 3,03,81,196 | 27.42% | 3.50 |
| Mid-cap | 2,45,496.15 | 5,14,213.12 | 27.95% | 1,19,56,147 | 2,67,68,077 | 30.82% | 4.00 |
| Large & mid-cap | 1,63,175.58 | 3,54,112.84 | 29.47% | 82,99,513 | 1,45,31,964 | 20.53% | 5.00 |
| Flexi-cap | 2,90,269.65 | 5,88,389.52 | 26.56% | 1,31,61,385 | 2,50,35,055 | 23.90% | 5.50 |
| Value / contra | 1,17,251.12 | 2,09,180.02 | 21.28% | 53,08,373 | 91,16,444 | 19.75% | 7.00 |
| Dividend yield | 18,581.44 | 30,635.84 | 18.14% | 7,85,733 | 11,82,650 | 14.60% | 8.00 |
| Large-cap | 2,67,581.89 | 3,90,384.40 | 13.42% | 1,30,47,923 | 1,69,60,523 | 9.14% | 9.50 |
| Focused | 1,13,547.57 | 1,79,900.45 | 16.58% | 51,59,456 | 56,45,306 | 3.05% | 9.50 |
| ELSS tax saver | 1,79,802.65 | 2,30,662.36 | 8.66% | 1,54,23,310 | 1,61,06,808 | 1.46% | 11.00 |
| Total active equity funds | 19,08,087.63 | 37,54,274.57 | 25.31% | 10,69,73,583 | 19,09,90,944 | 21.31% | N/A |
↔ Scroll horizontally to view the full table.
Source: AMFI September 2023 and September 2026 monthly reports. CAGRs and combined scores are calculated from the published figures. AMFI’s total AUM figures are retained; adding category figures can produce minor rounding differences.
Multi-cap funds recorded the highest annualised growth in both assets and folios, giving them a combined score of 1.00.
Leading both measures is significant for this comparison. The category expanded strongly in asset value while its account base also grew rapidly.
Its starting size still matters. A smaller category needs a lower rupee addition than a larger one to achieve the same percentage growth. The table therefore includes both starting and ending values alongside the growth rates.
The combined sectoral and thematic group ranked second on both AUM and folio growth.
This is a broad reporting group containing funds with different investment themes and sector exposures. Its position describes their combined expansion. Individual schemes within the group can have very different growth patterns.
Combining the two categories also keeps the comparison aligned with the older report, where they appeared together.
Small-cap funds ranked third on AUM growth and fourth on folio growth. Mid-cap funds ranked fifth and third respectively.
That explains their combined scores of 3.50 and 4.00.
Small-cap funds had faster asset growth; mid-cap funds had faster account growth. Using both measures preserves that distinction instead of treating either one as the complete picture.
Flexi-cap funds had the largest AUM among the comparison groups at both dates. Yet they ranked sixth on AUM CAGR.
A larger starting base changes the arithmetic. Consider two hypothetical categories:
The second category adds far more money while recording a lower percentage increase.
That is why the flexi-cap row deserves attention alongside the faster-growing categories. Its position reflects a large asset base expanding further, while the combined score measures relative growth.
Large & mid-cap funds illustrate another difference. Their assets grew faster than those of mid-cap funds, but their folios grew more slowly. Their combined score captures both positions.
Large-cap, focused and ELSS funds occupied the bottom three places in the combined ranking. All three still recorded growth in both AUM and folios.
Large-cap and focused funds finished with the same score through different combinations. Focused funds had faster AUM growth, while large-cap funds had faster folio growth.
ELSS recorded the slowest expansion on both measures.
These figures establish the relative pace of growth. Explaining the causes would require additional evidence, including subscriptions, redemptions, scheme launches, investment performance and changes in investor behaviour.
A lower position in this table also leaves an important question unanswered: how did the funds perform for the people invested in them? That requires return and risk data.
AUM growth combines investment activity with changes in portfolio value. Fresh subscriptions add assets, redemptions remove them, and market movements change the value of investments already held.
For example, a hypothetical category beginning with ₹100 crore could receive ₹20 crore in net inflows and gain ₹10 crore through portfolio appreciation. It would finish with ₹130 crore, ignoring other adjustments. Its asset growth would be 30%, with contributions from both sources.
Folio growth measures a different part of the expansion. One investor can hold several folios across fund houses or schemes. The increase in accounts therefore cannot be read as an equal increase in unique investors.
The number and composition of schemes can change too. New launches, mergers and category changes may affect the totals. This comparison follows category-level figures at two dates rather than tracking an unchanged set of schemes.
CAGR summarises the annualised change between those dates. Growth within the period may have been uneven.
The score provides a quick way to compare asset growth and account growth with equal weight.
It also has a limitation: ranks show position, while the percentages show the size of the gap. Two categories can sit next to each other in the ranking despite having very different growth rates.
For investors reviewing their portfolios, the table is useful context. Fund selection still requires attention to:
The three-year comparison shows substantial expansion across active equity funds, with different categories growing at different speeds. The practical value lies in understanding those differences before connecting them to an investment decision.
Multi-cap funds led both measures, with AUM CAGR of 38.33% and folio CAGR of 35.71%. They received the lowest combined score of 1.00.
AUM CAGR measures growth in total assets managed. It includes the effects of investor subscriptions, redemptions, portfolio valuations and other changes. A fund’s investment return is measured separately.
A folio is an investment account record. A person can hold multiple folios, so folio counts can exceed the number of unique investors.
AMFI reported them together in September 2023 and separately in September 2026. Combining the newer figures aligns the reporting groups for this comparison. The same approach is used for value and contra funds.
Disclaimer: This article is for information and education only and does not constitute investment advice or a recommendation to invest in any fund or category. AUM and folio growth rankings do not measure investment returns or predict future performance. Mutual fund investments are subject to market risks. Read all scheme-related documents carefully.
No spam. Only new posts, simple explainers, and practical money checklists for busy professionals.
Finnovate is a SEBI-registered financial planning firm that helps professionals bring structure and purpose to their money. Over 3,500+ families have trusted our disciplined process to plan their goals - safely, surely, and swiftly.
Our team constantly tracks market trends, policy changes, and investment opportunities like the ones featured in this Weekly Capsule - to help you make informed, confident financial decisions.
Learn more about our approach and how we work with you:
No comments yet. Start the conversation. What would you add?
No spam. Only new posts, simple explainers, and practical money checklists.
You may also like
Explore September 2026 ETF and index fund flows, with category-wise inflows, outflows, AUM...

Equity fund net inflows rose 30.61% to ₹38,306.55 crore in September 2026. Compare 13 ca...

Equity mutual funds received ₹29,329 crore in August 2026. See which categories saw the ...

When should you exit a mutual fund? Learn when to hold, stop a SIP, rebalance or redeem ba...
Popular now

Learn how to easily download your NSDL CAS Statement in PDF format with our step-by-step g...

Looking for the best financial freedom books? Here’s a handpicked 2026 reading list with...
Learn what SIF investment means in India, SEBI rules, Rs 10 lakh minimum investment, avail...

Clear guide to mutual fund taxation in India for FY 2025–26 after July 2024 changes: equ...