
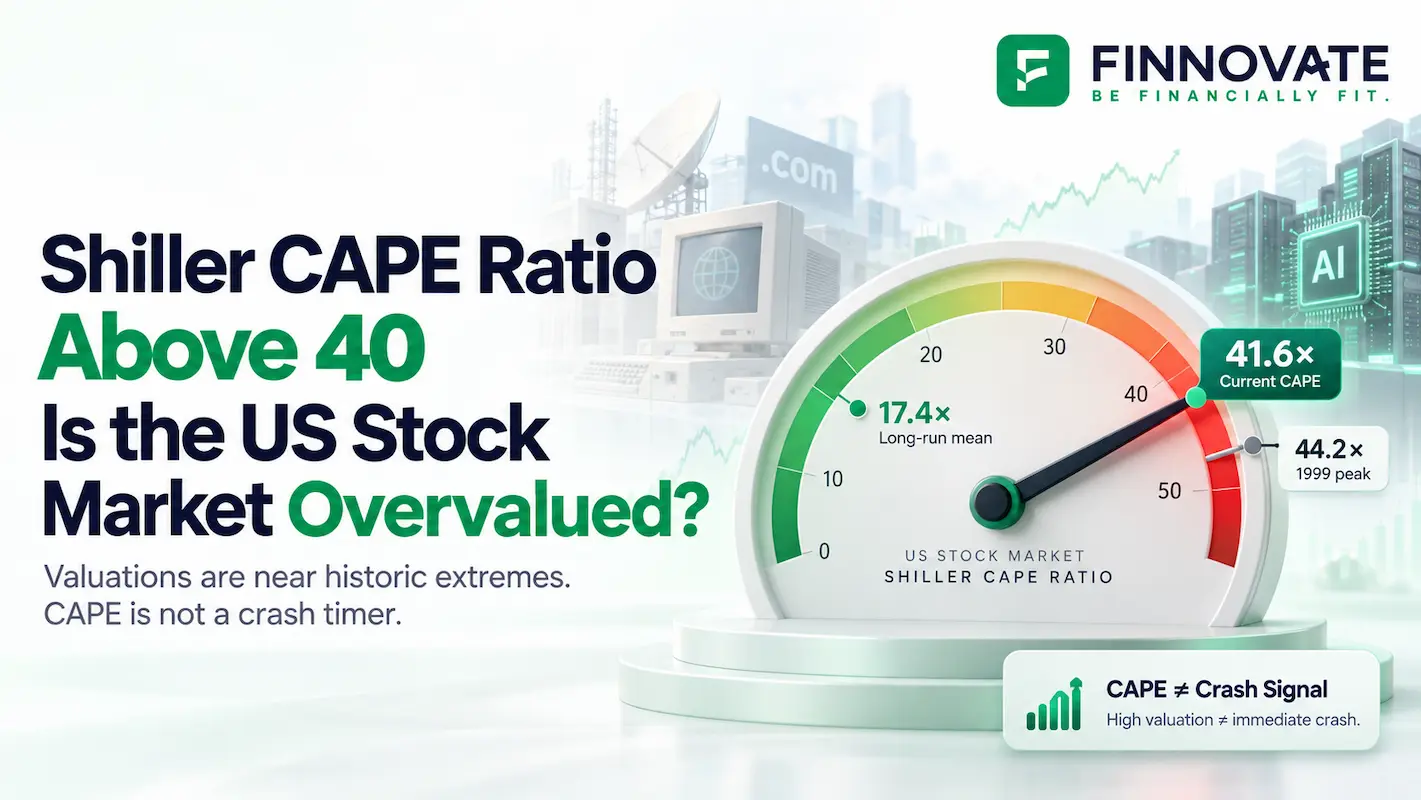
Shiller CAPE Ratio Above 40: Is the US Stock Market Overvalued?
The Shiller CAPE ratio is near its 1999 peak. Explore what it means for US stock valuation...
09 October 2026

Finnovate’s editorial team researches and creates financial content using trusted sources, regulatory references and inputs from subject experts.
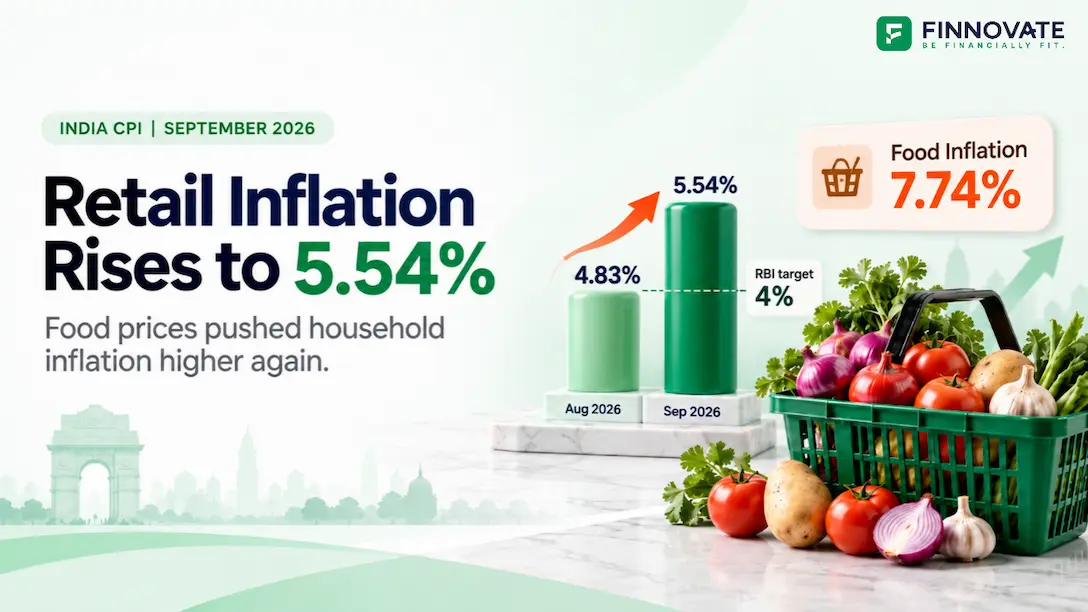
India's retail inflation climbed to 5.54% in September 2026, up from 4.83% in August. Food inflation rose even faster, reaching 7.74%. This was the fourth straight month that inflation remained above the Reserve Bank of India's 4% target.
The sharpest price movements were visible in everyday food items. Onion inflation crossed 108%, while ginger and garlic recorded increases of over 60% and 50%, respectively. Yet tomatoes and potatoes were still cheaper than they were a year earlier.
That contrast is important. September's inflation was marked by steep increases in some household essentials, more moderate increases across several other spending categories, and different experiences for rural and urban consumers.
The Ministry of Statistics and Programme Implementation (MoSPI) released the September Consumer Price Index (CPI) data on October 12, 2026. The figures below use the revised CPI series with 2024 as the base year.
The national inflation rate increased by 0.71 percentage points between August and September. Food inflation increased by 1.77 percentage points over the same period.
| Annual inflation measure | August 2026 | September 2026 | Change |
|---|---|---|---|
| Headline CPI | 4.83% | 5.54% | +0.71 pp |
| Food inflation (CFPI) | 5.97% | 7.74% | +1.77 pp |
| Rural CPI | 5.24% | 6.08% | +0.84 pp |
| Urban CPI | 4.31% | 4.88% | +0.57 pp |
| Rural food inflation | 6.17% | 8.06% | +1.89 pp |
| Urban food inflation | 5.64% | 7.18% | +1.54 pp |
Source: MoSPI, September 2026 CPI release. August figures are final and September figures are provisional. pp = percentage points. All inflation rates are year-on-year.
Food prices were a major source of pressure, but inflation also rose in transport, clothing, housing-related expenses and several service categories.
At 5.54%, headline inflation was also moving closer to the upper end of the RBI's inflation tolerance band. The RBI targets 4% CPI inflation, with a tolerance range of 2% to 6%.
India's headline inflation has increased every month since April 2026. It began at 3.48% in April, crossed 4% in June and reached 5.54% in September.
Over these six months, the annual inflation rate increased by 2.06 percentage points. September's increase was especially notable because it followed several months of steadily rising inflation.
The 5.54% headline figure compares September 2026 with September 2025. The monthly change gives another useful perspective.
The overall CPI index rose from 108.74 in August to 109.49 in September, an increase of approximately 0.69% in one month. The food price index rose from 110.73 to 112.17, an increase of approximately 1.30%.
Both measures show higher prices during September, with a sharper monthly rise in food.
Food inflation jumped from 5.97% in August to 7.74% in September. The increase was particularly sharp in onions and garlic, while ginger continued to record a high annual inflation rate despite easing from August.
The September release also showed that food inflation was far from uniform across vegetables.
| Food item | August 2026 | September 2026 |
|---|---|---|
| Onion | 48.78% | 108.09% |
| Ginger | 73.82% | 62.85% |
| Garlic | 43.60% | 54.62% |
| Lemon | 15.15% | 36.41% |
| Tomato | −31.09% | −8.62% |
| Potato | −13.15% | −11.50% |
Source: MoSPI, September 2026 CPI release. Figures show each item's annual inflation rate, rather than its price change from August to September.
Onion inflation more than doubled, rising from 48.78% in August to 108.09% in September. This means the onion price index was more than twice its September 2025 level.
Garlic inflation also accelerated, while ginger remained expensive compared with the previous year. Tomato and potato indices, meanwhile, were below their year-earlier levels.
Tomatoes offer an interesting example of how inflation rates work. Their annual inflation moved from −31.09% in August to −8.62% in September. A less negative rate shows that the year-on-year price decline became smaller.
CPI is calculated from a basket of hundreds of goods and services, with each item assigned a weight based on household spending. Onion has a much smaller weight than broad categories such as food, housing or transport. Even an exceptionally large increase in one item therefore has a limited direct effect on the overall index.
The Consumer Food Price Index (CFPI), which measures food inflation, increased by 7.74% in September.
The broader food-and-beverages division recorded 7.36% inflation. This division includes additional beverage and food-processing service components, so its rate differs from the CFPI reading.
For households, the important distinction is between the national average and their own spending. A family buying more of the food items experiencing steep increases may see its grocery bill rise faster than the overall food inflation rate.
Food attracted attention in September, but several non-food categories also recorded notable annual price increases.
Restaurants and accommodation services recorded 9.36% inflation, while transport inflation stood at 5.01%. Clothing and footwear, education services and household maintenance experienced smaller increases.
The following table covers all 12 spending divisions under the revised CPI series, arranged from the highest to the lowest annual inflation rate.
| Spending division | September 2026 inflation |
|---|---|
| Personal care, social protection and miscellaneous goods and services | 13.75% |
| Restaurants and accommodation services | 9.36% |
| Food and beverages | 7.36% |
| Transport | 5.01% |
| Paan, tobacco and intoxicants | 4.80% |
| Education services | 3.94% |
| Clothing and footwear | 3.93% |
| Furnishings, household equipment and routine maintenance | 3.11% |
| Housing, water, electricity, gas and other fuels | 2.74% |
| Information and communication | 2.44% |
| Recreation, sport and culture | 2.16% |
| Health | 1.40% |
Source: MoSPI, September 2026 CPI release, Annexure I. All figures are annual combined rural and urban inflation rates.
The broad division recorded 13.75% inflation, but its components moved very differently.
For example, the narrower personal care group recorded inflation of just 2.22%, while the other personal effects group recorded 38.69%. Within the latter, silver jewellery was among the items experiencing an exceptionally large annual price increase, at 87.80%.
The category's increase was concentrated in food and beverage serving services, which recorded 9.39% inflation. Accommodation services recorded a much lower rate of 2.43%.
For consumers, this points to stronger price increases in eating-out services than in accommodation within this category.
Rural inflation reached 6.08% in September, compared with 4.88% in urban India.
The difference was 1.20 percentage points. In August, the rural-urban gap was 0.93 percentage points, indicating that the gap widened during September.
Food inflation was also higher in rural areas. Rural food inflation rose to 8.06%, while urban food inflation stood at 7.18%.
Overall inflation: Rural 6.08% | Urban 4.88%
Food inflation: Rural 8.06% | Urban 7.18%
Overall inflation gap: 1.20 percentage points, up from 0.93 percentage points in August.
Rural and urban CPI figures are calculated using separate spending weights and price observations. The share of expenditure allocated to food, housing, transport and services differs between the two baskets.
The inflation experienced by an individual household can vary further. A family with high food expenditure, a household paying school fees and a household with higher transport costs may experience different increases even within the same city.
Inflation also varied across states and union territories. Among the larger states, Tamil Nadu recorded 6.81% inflation, followed closely by Odisha at 6.70% and Madhya Pradesh at 6.68%.
Maharashtra and Gujarat recorded rates below the national figure of 5.54%, while Delhi's inflation rate was lower at 3.40%.
| Selected state / UT | September 2026 CPI inflation |
|---|---|
| Tamil Nadu | 6.81% |
| Odisha | 6.70% |
| Madhya Pradesh | 6.68% |
| Telangana | 6.64% |
| Maharashtra | 5.18% |
| Gujarat | 5.11% |
| Delhi, NCT | 3.40% |
Source: MoSPI, September 2026 CPI release, Annexure III. Selected state and union territory figures, combined rural and urban.
These differences reflect changes in the prices recorded within each state's CPI basket. They also explain why the national average cannot describe every household's experience.
One distinction is worth keeping in mind when comparing states: inflation measures the rate of price change, not the actual cost of living. A state with lower inflation may still have higher prices for certain goods and services than a state with higher inflation.
Core inflation offers another way to assess price pressures in the economy. It removes selected food and fuel components, which can experience large and frequent price swings.
For September 2026, ICRA estimated core inflation at 4.6%.
This is an analytical estimate rather than a separately published official headline CPI rate. Core inflation calculations can differ depending on the exclusions used.
Its relevance becomes greater when headline inflation is being pushed up by volatile items. If price increases remain concentrated in food, their impact on inflation may change as supplies and prices adjust. If businesses across several sectors continue raising prices, inflation can become more persistent.
That wider pattern is important for understanding the direction of inflation over the coming months. The category-wise figures already show notable price increases outside groceries, although their contribution to overall CPI depends on their respective weights.
The September CPI release arrived just five days after the RBI's October monetary policy decision.
On October 7, 2026, the Monetary Policy Committee increased the repo rate by 25 basis points, taking it from 5.25% to 5.50%. The RBI also changed its monetary policy stance from neutral to calibrated tightening.
The RBI had already been responding to rising inflation and the risks associated with food and energy prices. Its October decision was taken before the September CPI figures were released on October 12.
Repo rate: 5.50%, increased by 25 basis points.
Policy stance: Calibrated tightening.
FY2026-27 CPI inflation forecast: 5.2%, revised upward from 5.0%.
Next MPC meeting: December 2–4, 2026.
The September reading of 5.54% adds another month of rising inflation to the information available to the RBI.
The central bank has indicated that its near-term policy choices under the calibrated tightening stance are a further rate increase or a pause, depending on inflation, growth and the extent to which price pressures spread through the economy.
Higher policy rates can increase borrowing costs, particularly for floating-rate loans linked to external benchmarks such as the repo rate.
For borrowers, the actual effect depends on the loan's benchmark, the bank's applicable lending rate and the next interest-rate reset date. A change in the lending rate may affect the EMI, the remaining tenure or both, depending on the loan terms.
Deposit rates can also respond to changes in monetary policy, although individual banks decide their rates based on funding needs, competition and other factors.
For households already managing loans, the practical figure to check is the revised interest rate communicated by their lender and its impact on future repayments.
September's CPI data leaves three important developments to track in the coming months.
The October CPI release will also provide another reading after the RBI's October rate hike. It will be useful for assessing whether the recent rise in annual inflation is continuing and which spending categories are contributing most.
For personal budgets, the broader lesson from September's numbers is to follow the prices that account for a meaningful share of actual household spending. The national CPI rate is a useful reference, while food, education, healthcare, housing and transport costs can follow different paths.
India's headline CPI inflation was 5.54% in September 2026, compared with 4.83% in August. Food inflation, measured by the Consumer Food Price Index, was 7.74%.
Food prices were a major source of the increase, with sharp annual inflation in items such as onions and garlic. Prices also increased across several non-food categories. The annual inflation rate was influenced by both current price movements and the comparison with September 2025.
Yes. The RBI's medium-term CPI inflation target is 4%, with a tolerance band of 2% to 6%. September's 5.54% rate was above the target but remained within the tolerance band.
Annual inflation compares prices with the same month a year earlier. Monthly inflation compares prices with the preceding month. In September 2026, the annual CPI inflation rate was 5.54%, while the overall CPI index rose by approximately 0.69% from August.
CPI reflects a weighted average basket of household purchases. Your actual expenses depend on the products and services you buy and the prices in your area. If your spending is concentrated in categories experiencing larger price increases, your personal inflation rate can exceed the national average.
The Consumer Price Index measures price changes in goods and services purchased by households. The Wholesale Price Index measures price changes in a basket of goods at the wholesale level. They use different baskets, weights and methodologies, so their inflation rates can differ.
Inflation assumptions should reflect the type of future expense and the time available. General living costs, education and healthcare may experience different rates of price increase. Long-term estimates should be reviewed periodically using relevant cost trends rather than relying entirely on a single month's CPI reading.
MoSPI has scheduled the October 2026 Consumer Price Index release for November 12, 2026, subject to its official release calendar.
Disclaimer: This article is for information and education only and does not constitute investment advice. September 2026 CPI figures are provisional and may be revised in subsequent official releases. Financial decisions should be based on individual circumstances and applicable terms.
No spam. Only new posts, simple explainers, and practical money checklists for busy professionals.
Finnovate is a SEBI-registered financial planning firm that helps professionals bring structure and purpose to their money. Over 3,500+ families have trusted our disciplined process to plan their goals - safely, surely, and swiftly.
Our team constantly tracks market trends, policy changes, and investment opportunities like the ones featured in this Weekly Capsule - to help you make informed, confident financial decisions.
Learn more about our approach and how we work with you:
No comments yet. Start the conversation. What would you add?
No spam. Only new posts, simple explainers, and practical money checklists.
You may also like
The Shiller CAPE ratio is near its 1999 peak. Explore what it means for US stock valuation...

Can Starlink change internet access in India? Explore why Jio and Airtel signed deals, how...

AI demand is pushing up memory chip prices. Here's why the shortage could make smartphones...

FPIs sold ₹35,861 crore in Indian equities in September 2026. See which sectors saw outf...
Popular now

Learn how to easily download your NSDL CAS Statement in PDF format with our step-by-step g...

Looking for the best financial freedom books? Here’s a handpicked 2026 reading list with...

Learn what SIF investment means in India, SEBI rules, Rs 10 lakh minimum investment, avail...

Clear guide to mutual fund taxation in India for FY 2025–26 after July 2024 changes: equ...