
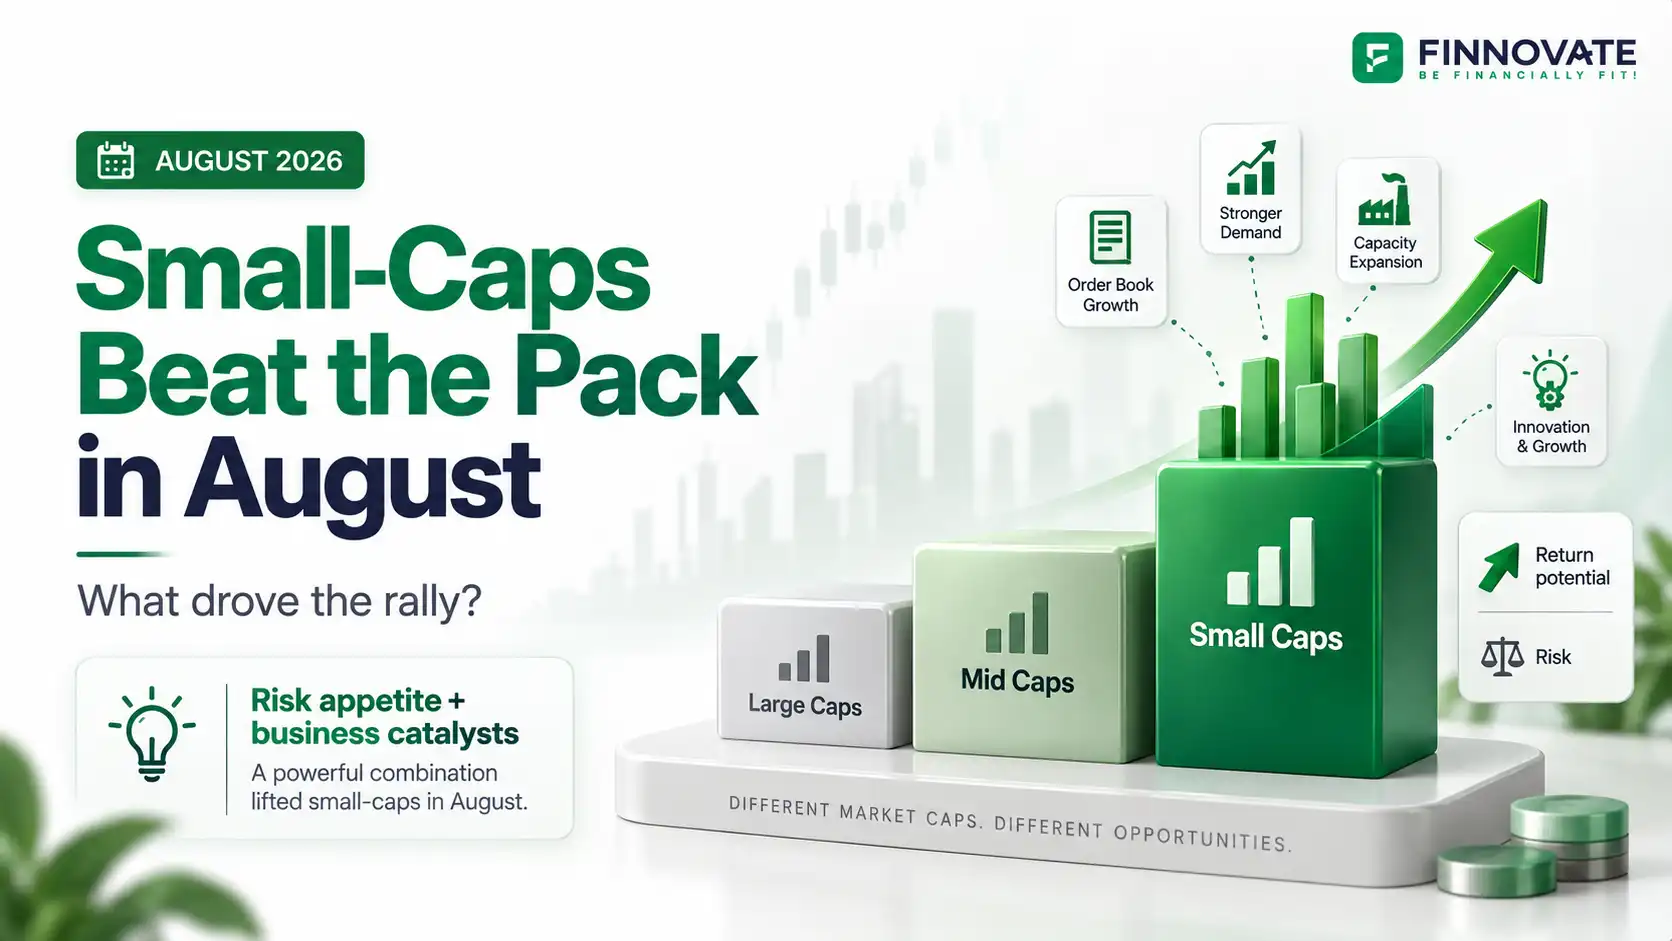
Top Small-Cap Stocks in August 2026: Why Small Caps Outperformed
Nifty Smallcap 100 rose 3.16% in August 2026. See which small-cap stocks led, what drove t...
08 September 2026
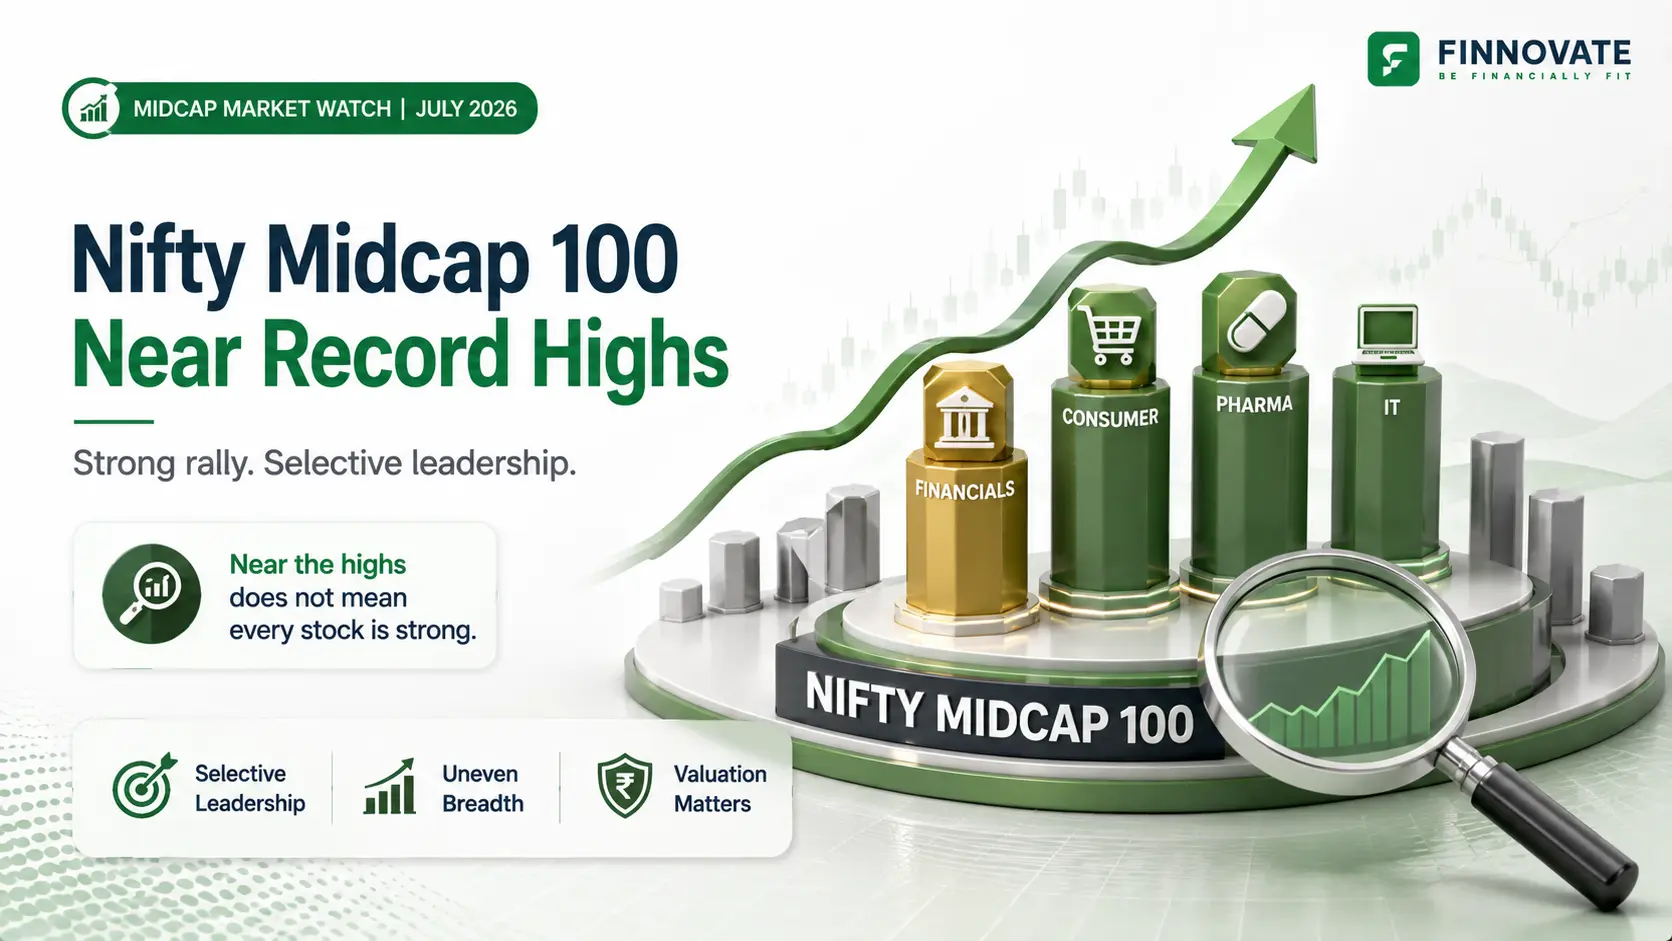
Indian mid-cap stocks entered August 2026 with strong momentum.
The Nifty Midcap 100 gained 1.81% in July 2026 and was up 9.61% over one year. From its 52-week low, the index had rebounded about 20.9% and was trading only around 0.4% below its yearly peak.
That is notable because the rally happened despite elevated crude-oil prices, Middle East tensions and an uncertain global backdrop.
Table of Contents
| Indicator | July 2026 |
|---|---|
| Nifty Midcap 100 monthly return | 1.81% |
| One-year return | 9.61% |
| Bounce from 52-week low | 20.9% |
| Distance from 52-week high | About 0.4% |
| Stocks positive over one month | 52 |
| Stocks negative over one month | 48 |
| Stocks positive over one year | 55 |
| Stocks negative over one year | 45 |
The ranking combines four measures rather than relying only on recent price returns.
Measures recent price momentum and whether the stock has attracted fresh buying interest.
Provides a longer view of whether the stock’s performance has been sustained.
Measures recovery strength and how significantly the market has reassessed the stock from its weakest level.
Shows whether the stock has merely recovered from a low or is already trading close to its strongest level of the year.
The four individual rankings are combined to create an average rank.
| Company | 1-Month Return | 1-Year Return | Bounce From Low | Distance From Peak |
|---|---|---|---|---|
| Laurus Labs | 19.61% | 107.58% | 124.06% | 0.64% |
| Federal Bank | 8.67% | 77.17% | 93.75% | 0.35% |
| Radico Khaitan | 10.20% | 59.01% | 73.92% | 3.26% |
| Nykaa | 7.38% | 59.24% | 66.78% | 1.24% |
| Bharat Forge | 2.84% | 88.61% | 100.36% | 1.47% |
| M&M Financial Services | 22.66% | 50.43% | 54.75% | 6.03% |
| Aditya Birla Capital | 3.33% | 57.80% | 66.67% | 1.94% |
| Exide Industries | 15.45% | 16.45% | 55.92% | 3.01% |
| Kalyan Jewellers | 58.60% | 3.13% | 87.52% | 5.49% |
| Paytm | 17.16% | 22.77% | 43.71% | 4.95% |
| OFSS | 3.94% | 32.15% | 79.65% | 6.50% |
| IndusInd Bank | 9.39% | 26.55% | 42.27% | 6.20% |
| IDFC First Bank | 6.73% | 23.39% | 46.07% | 4.42% |
| Lenskart | 8.86% | 0.00% | 57.43% | 2.62% |
| BHEL | -1.85% | 70.46% | 98.15% | 8.97% |
| Aurobindo Pharma | 0.08% | 38.62% | 55.50% | 3.47% |
| AU Small Finance Bank | 0.86% | 41.07% | 53.34% | 4.07% |
| L&T Finance | 0.08% | 53.51% | 59.98% | 8.15% |
| National Aluminium | 3.21% | 89.40% | 94.80% | 21.26% |
| Coforge | 17.49% | -1.50% | 70.82% | 13.45% |
Source: Finnovate research, NSE Data.
Average one-month return
Average one-year return
Average bounce from the yearly low
Average distance from the yearly peak
One of the clearest patterns was the presence of financial companies including Federal Bank, M&M Financial Services, Aditya Birla Capital, Paytm, IndusInd Bank, IDFC First Bank, AU Small Finance Bank and L&T Finance.
It is better to see this cluster as exposure to several parts of India’s domestic financial system rather than one single “financial inclusion” trade.
Federal Bank, IndusInd Bank, IDFC First Bank and AU Small Finance Bank are exposed to credit growth, deposits and asset-quality trends.
M&M Financial Services, Aditya Birla Capital and L&T Finance are more sensitive to borrowing costs, funding conditions and retail or corporate credit demand.
Paytm represents a different part of the ecosystem through payments and financial-product distribution.
Index inclusion, company execution and institution-specific developments can also influence individual stocks.
Another visible cluster included Nykaa, Kalyan Jewellers, Lenskart and Radico Khaitan.
Laurus Labs topped the ranking, while Aurobindo Pharma also appeared among the strongest 20 stocks.
Potential sector drivers include contract development and manufacturing, generic-drug opportunities, export demand, new product launches, capacity utilisation and company-specific earnings recovery.
OFSS and Coforge also entered the top 20. Their performance may partly reflect renewed interest in established IT businesses after a period when global technology markets had been heavily dominated by AI-linked positioning.
| Time period | Positive stocks | Negative stocks |
|---|---|---|
| 1 month | 52 | 48 |
| 1 year | 55 | 45 |
At first glance, this shows reasonable breadth. But it also means almost half the index was still on the losing side.
Several names appeared towards the lower end of the overall ranking, including KPIT Technologies, Patanjali Foods, Tata Elxsi, RVNL, PI Industries, Jubilant FoodWorks, IRCTC, Godfrey Phillips and Swiggy.
An index can move higher even when a meaningful portion of its constituents are struggling.
How many stocks are actually participating in the rally?
How many companies are reporting improving profits?
Is one theme doing most of the work?
Are the strongest companies becoming materially more expensive than the rest?
No. A 52-week high is a price signal, not a valuation signal.
Investors still need to assess revenue and profit growth, free cash flow, debt, return on capital, competitive advantage, management execution, valuation and position size.
If profits continue catching up with stock prices, valuations become easier to justify.
Strong discretionary spending can support consumer-facing businesses.
Predictable financing conditions can support banks, NBFCs and consumption.
Improving private and public investment can help industrial and manufacturing businesses.
Continued domestic and foreign institutional demand can support liquidity.
Lower crude and reduced geopolitical risk would improve the macro backdrop.
| Indicator | Why it matters |
|---|---|
| Earnings growth | Shows whether price gains are supported |
| Valuation | Indicates how much optimism is already priced in |
| Market breadth | Shows whether participation is expanding |
| Midcap 100 vs Nifty 50 | Measures relative market leadership |
| Crude oil | Affects inflation, margins and the rupee |
| RBI policy | Influences financing conditions |
| FPI and DII flows | Shows institutional demand |
| Sector leadership | Identifies where momentum is concentrated |
| Drawdowns | Tests the resilience of the rally |
The most accurate answer today is: potentially, but it remains selective.
The Nifty Midcap 100 recovered strongly from its lows and moved close to its yearly high. Several companies also showed impressive momentum over both one-month and one-year periods.
The index gained about 1.81% during July and was up around 9.61% over one year.
It was only about 0.4% below its peak after recovering approximately 20.9% from its yearly low.
Financials had the largest representation, followed by consumer-facing companies, while healthcare, IT, industrial and commodity names also appeared.
Partly. Fifty-two of the 100 stocks had positive one-month returns, while 48 were negative. Over one year, 55 were positive and 45 were negative.
No. It shows price strength but does not tell investors whether the stock is fairly valued or whether earnings can support the price.
Possible factors include domestic credit growth, stable interest-rate expectations, funding conditions, asset-quality expectations and company-specific developments.
High valuations can make stocks more sensitive to earnings disappointments, liquidity changes and shifts in investor sentiment.
Disclaimer: This article is for general information and educational purposes only. The stocks mentioned are used only to explain market trends and do not constitute investment recommendations. Past performance does not guarantee future returns. Investors should evaluate valuation, fundamentals, risk profile and suitability before making investment decisions.
No spam. Only new posts, simple explainers, and practical money checklists for busy professionals.
Finnovate is a SEBI-registered financial planning firm that helps professionals bring structure and purpose to their money. Over 3,500+ families have trusted our disciplined process to plan their goals - safely, surely, and swiftly.
Our team constantly tracks market trends, policy changes, and investment opportunities like the ones featured in this Weekly Capsule - to help you make informed, confident financial decisions.
Learn more about our approach and how we work with you:
No comments yet. Start the conversation. What would you add?
No spam. Only new posts, simple explainers, and practical money checklists.
You may also like
Nifty Smallcap 100 rose 3.16% in August 2026. See which small-cap stocks led, what drove t...
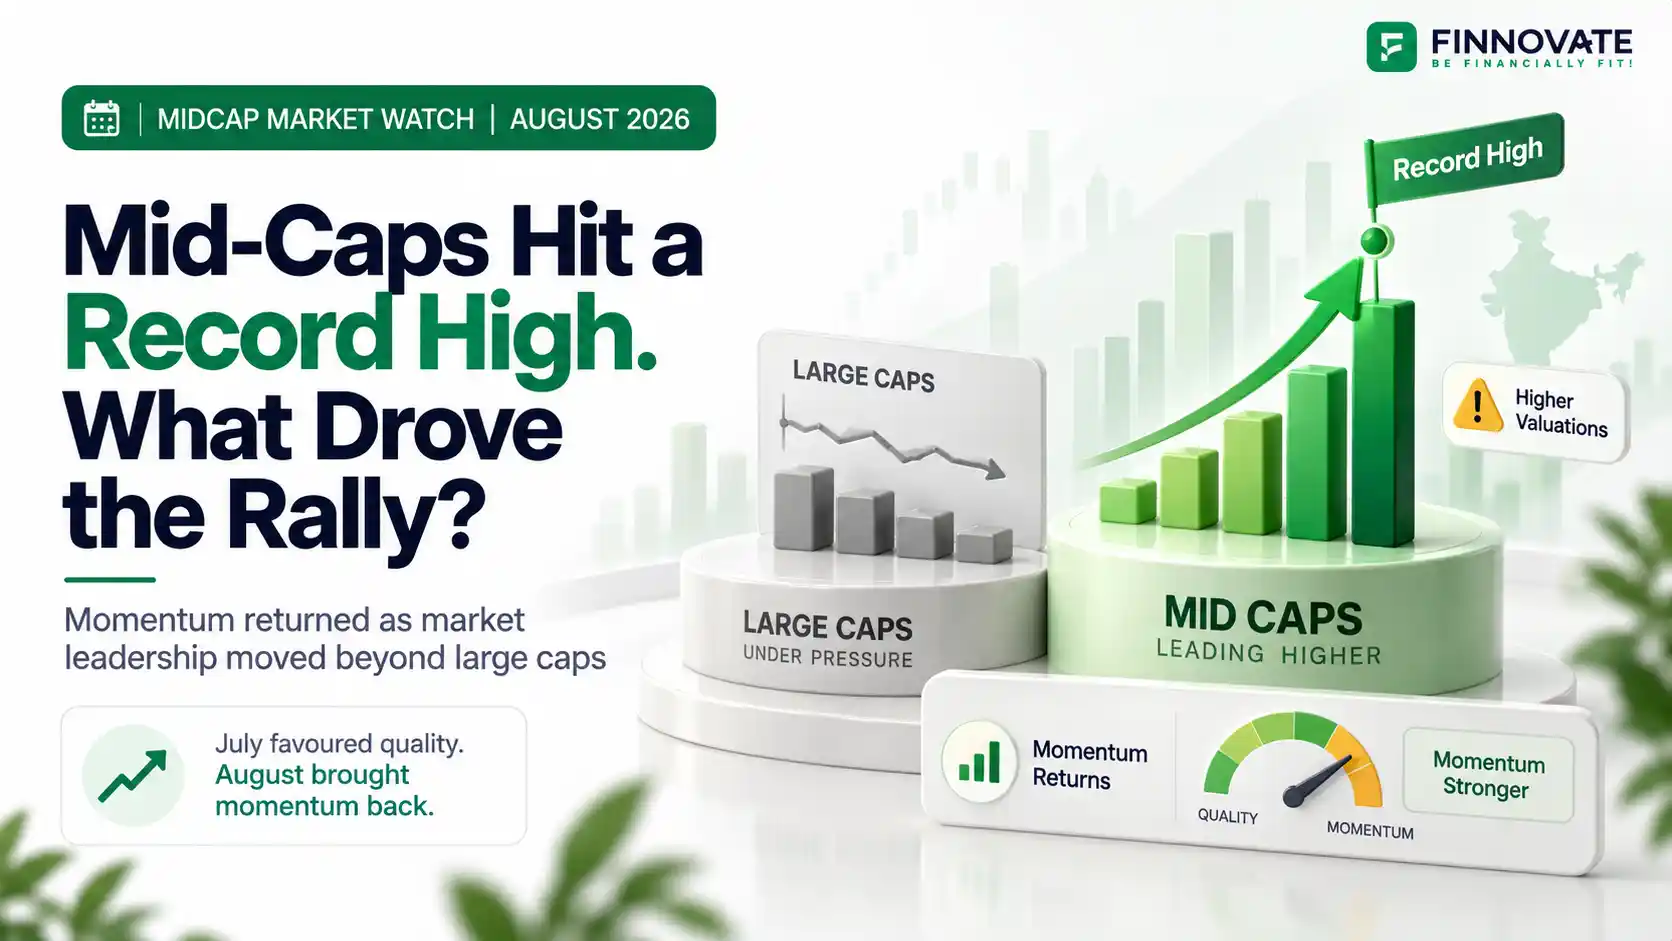
Nifty Midcap 100 rose 2.15% in August 2026. See which mid-cap stocks led the rally, key se...
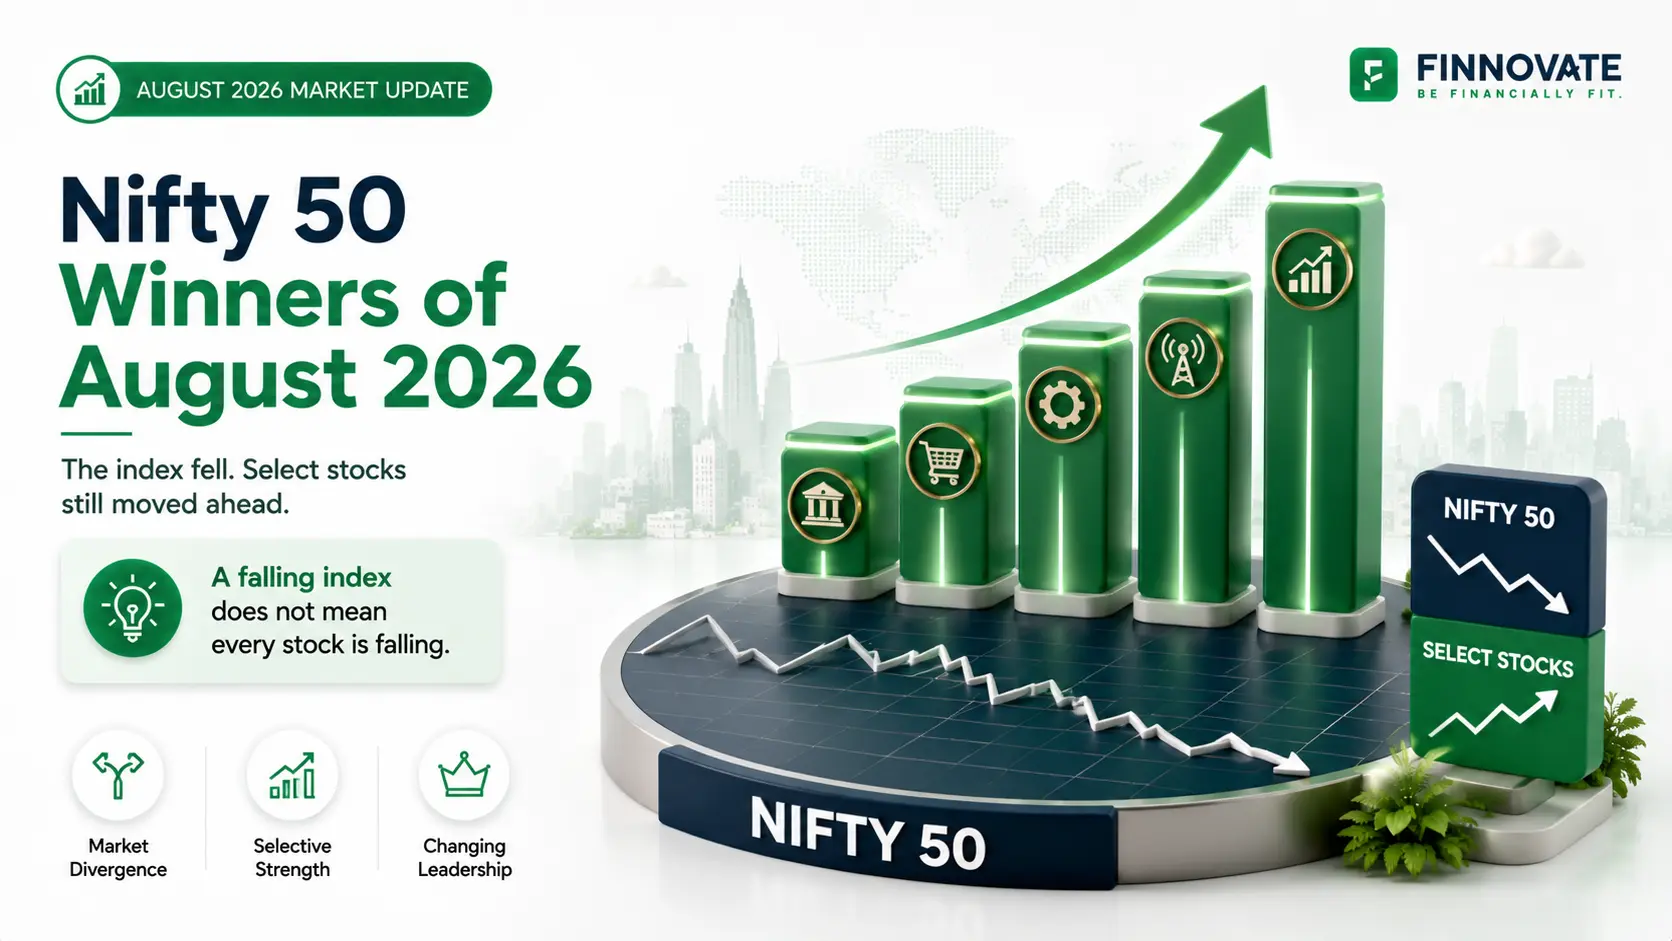
See the best-performing Nifty 50 stocks in August 2026, which sectors led the market, and ...
See the best-performing Nifty 50 stocks in July 2026, ranked using one-month returns, one-...
Popular now

Learn how to easily download your NSDL CAS Statement in PDF format with our step-by-step g...

Looking for the best financial freedom books? Here’s a handpicked 2026 reading list with...

Learn what SIF investment means in India, SEBI rules, Rs 10 lakh minimum investment, avail...

Clear guide to mutual fund taxation in India for FY 2025–26 after July 2024 changes: equ...