Large-Cap Mutual Funds: How Costs Change the Information Ratio

Finnovate’s editorial team researches and creates financial content using trusted sources, regulatory references and inputs from subject experts.
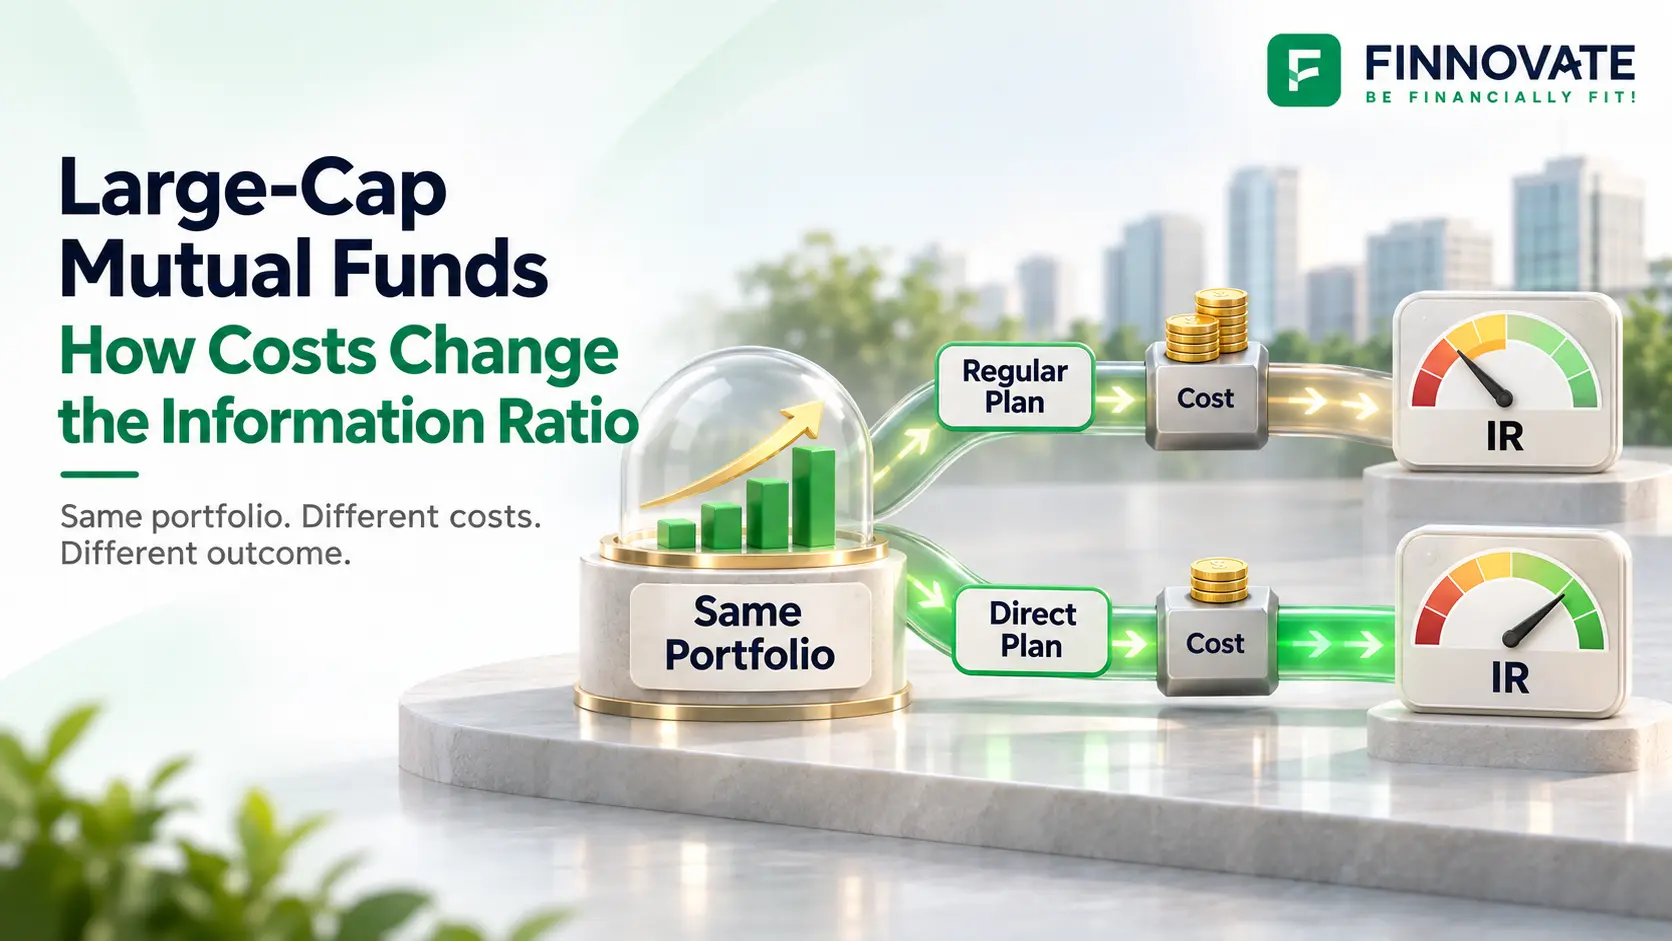
A mutual fund can hold the same stocks, follow the same strategy and have the same fund manager, yet deliver different returns to two investors.
The difference can come from the plan they choose.
Direct and regular plans share a portfolio, but their expenses differ. Over time, that cost gap affects returns. It can also change how a fund performs against its benchmark after accounting for the variability of its excess returns. This is what the Information Ratio, or IR, helps measure.
In the 20-fund comparison below, 10 regular plans have a positive five-year IR, compared with 19 direct plans. Nine funds move from a negative IR in their regular plan to a positive IR in their direct plan.
The comparison raises a useful question: how much of a fund’s performance reaches the investor after costs?
What does Information Ratio measure?
Returns tell you how much an investment grew. Information Ratio adds a benchmark comparison and considers how variable the excess returns were.
The basic formula is:
Information Ratio = Excess return over the benchmark ÷ Tracking error
Tracking error measures how much the fund’s returns vary relative to the benchmark. SEBI’s disclosure methodology uses the scheme’s Tier 1 benchmark and daily returns to calculate that variability.
Consider a simplified example using annualised figures. A fund generates an average annual excess return of 2% with a tracking error of 4%. Its IR is 0.50. Another generates the same excess return with tracking error of 2%, giving it an IR of 1.00.
The second fund produced the same excess return with less variability relative to its benchmark.
A positive IR indicates positive excess return under the calculation used. A negative IR indicates negative excess return. The ratio has no percentage unit.
IR measures historical benchmark-relative performance. It cannot establish that a fund will outperform in the future.
How to read this comparison
The table brings together returns, Information Ratios and assets under management for 20 selected large-cap funds.
- Three-year and five-year returns are shown for direct plans and expressed as annualised returns, or CAGR.
- Five-year IR is shown separately for regular and direct plans.
- Funds are arranged by regular-plan IR, from highest to lowest, with ties retained.
- IR values are ratios. Return figures are percentages, while AUM is expressed in ₹ crore.
- The findings apply to these 20 funds. Comparisons also need to account for each scheme’s benchmark and the calculation period.
Large-cap funds: Returns and Information Ratio comparison
| Fund | 3-year direct return (%) | 5-year direct return (%) | 5-year regular IR | 5-year direct IR | AUM (₹ crore) |
|---|---|---|---|---|---|
| Nippon India Large Cap Fund | 12.79 | 13.07 | 0.95 | 1.25 | 55,892.71 |
| ICICI Prudential Large Cap Fund | 12.54 | 11.27 | 0.62 | 0.83 | 81,910.47 |
| HDFC Large Cap Fund | 10.77 | 10.96 | 0.53 | 0.75 | 40,367.23 |
| Taurus Large Cap Fund | 16.03 | 11.34 | 0.39 | 0.42 | 69.64 |
| Invesco India Large Cap Fund | 16.16 | 11.60 | 0.38 | 0.78 | 2,162.61 |
| Baroda BNP Paribas Large Cap Fund | 13.35 | 10.81 | 0.24 | 0.67 | 2,659.91 |
| DSP Large Cap Fund | 13.47 | 10.62 | 0.19 | 0.41 | 7,376.84 |
| Edelweiss Large Cap Fund | 12.20 | 10.71 | 0.12 | 0.81 | 1,490.91 |
| Bandhan Large Cap Fund | 15.33 | 10.91 | 0.11 | 0.51 | 2,312.46 |
| JM Large Cap Fund | 12.20 | 10.47 | 0.01 | 0.33 | 375.65 |
| Tata Large Cap Fund | 12.59 | 9.76 | -0.02 | 0.38 | 2,775.01 |
| Aditya Birla Sun Life Large Cap Fund | 11.70 | 9.45 | -0.02 | 0.29 | 30,150.55 |
| HSBC Large Cap Fund | 12.16 | 9.49 | -0.04 | 0.29 | 1,884.61 |
| Bank of India Large Cap Fund | 13.20 | 9.68 | -0.06 | 0.26 | 238.56 |
| Kotak Large Cap Fund | 12.25 | 9.67 | -0.16 | 0.39 | 11,135.82 |
| SBI Large Cap Fund | 11.09 | 9.46 | -0.21 | 0.03 | 55,953.92 |
| Groww Large Cap Fund | 12.22 | 9.35 | -0.25 | 0.23 | 148.11 |
| ITI Large Cap Fund | 12.30 | 9.14 | -0.36 | 0.15 | 374.03 |
| Franklin India Large Cap Fund | 12.08 | 8.15 | -0.39 | -0.17 | 7,562.75 |
| Canara Robeco Large Cap Fund | 12.76 | 9.76 | -0.40 | 0.21 | 17,504.44 |
Scroll horizontally to view the full table.
Report reference date: 6 November 2026. Returns are annualised; IR values are ratios; AUM is in ₹ crore.
What stands out in the numbers?
Ten positive regular-plan IRs become 19 in direct plans
Half of the regular plans in this comparison have positive five-year IRs. Among direct plans, all except Franklin India Large Cap Fund have positive readings.
Tata Large Cap moves from -0.02 to 0.38, while Kotak Large Cap moves from -0.16 to 0.39. Canara Robeco Large Cap moves from -0.40 to 0.21.
These changes show why the plan matters when reviewing a fund’s record. An investor looking only at direct-plan performance may get an incomplete picture of the results delivered by the regular plan they actually hold.
The order changes between plans
Nippon India Large Cap has the highest IR in both columns: 0.95 for regular and 1.25 for direct.
But the order below it changes.
Edelweiss Large Cap has a regular-plan IR of 0.12, placing it eighth among these funds. Its direct-plan IR of 0.81 places it third, behind Nippon India and ICICI Prudential.
That difference makes the plan label an essential part of any performance comparison.
The highest return and highest IR need not belong to the same fund
Invesco India Large Cap has the highest three-year direct-plan return in the table at 16.16%, followed by Taurus at 16.03%.
Nippon India Large Cap leads on five-year direct-plan returns at 13.07% and also has the highest five-year direct-plan IR.
Three-year returns and five-year IR answer different questions over different periods. They should be read together without treating one as confirmation of the other.
Why expenses matter to Information Ratio
AMFI explains that direct and regular plans of a scheme have the same portfolio and fund manager. Direct plans have lower expenses because they exclude distributor commissions and related distribution costs. Both plans still bear scheme expenses.
Those expenses affect the NAV and the returns investors receive.
Suppose a portfolio earns a modest lead over its benchmark before expenses. A higher expense burden can absorb that lead. A lower expense burden leaves more of it with the investor.
This helps explain why a scheme can show positive IR in its direct plan and negative IR in its regular plan.
However, the difference between two IR values is not the fee difference. IR also depends on tracking error. A gap of 0.40 between plans cannot be read as a 0.40-percentage-point expense gap.
To understand the cost difference itself, compare the plans’ expense disclosures.
Positive returns can still come with negative IR
Franklin India Large Cap illustrates why returns and IR deserve separate attention.
Its five-year direct-plan return in the table is 8.15%, while its direct-plan IR is -0.17.
A positive return describes growth in the investment over the stated period. A negative IR describes negative excess return relative to the benchmark under the methodology used.
Both can occur together.
The same distinction applies to investor experience. A fund’s published five-year return describes a particular holding period. Someone who invested through SIPs, added a lump sum later or withdrew along the way will have a different personal return.
AUM also answers a separate question: how much money the fund manages. It cannot establish how many investors outperformed a benchmark or what returns they personally earned.
How investors can use the comparison
Start with the exact plan and option you hold. Compare its performance with the appropriate benchmark over matching periods.
Then examine whether the result holds across other periods. A single five-year snapshot can be influenced by the starting date, ending date and market conditions within that window.
Look at expenses, portfolio concentration, fund-manager changes and the fund’s role in your wider portfolio. IR adds useful context, but it does not capture every form of risk.
Where IR is negative, examine the underlying return shortfall and tracking error separately. The ratio alone may not give an intuitive ranking of underperforming funds.
For these 20 funds, the main finding is the difference between plan-level results. Checking the fund name is only half the job. Checking the plan tells you which performance record applies to your investment.
FAQs
1. What is Information Ratio in mutual funds?
Information Ratio compares a fund’s excess return over its benchmark with the variability of that excess return. It helps assess historical benchmark-relative performance. Comparisons are most useful when the period and calculation method are consistent.
2. Does a negative Information Ratio mean the fund lost money?
A fund can generate a positive absolute return and still have a negative IR if its excess return relative to the benchmark is negative. Absolute returns and benchmark-relative returns measure different things.
3. Why can direct and regular plans have different Information Ratios?
The plans share the same portfolio but have different expenses. Those expenses affect their net returns and, therefore, their benchmark-relative performance. The size of the IR difference also depends on the ratio’s tracking-error component.
4. Should I choose the fund with the highest Information Ratio?
Use IR alongside returns, costs, portfolio risks, investment horizon and performance across different periods. A high historical IR offers information about the period measured, but does not guarantee future outperformance.
Disclaimer: This article is for information and education. Fund comparisons are not recommendations to buy, sell or switch investments. Mutual fund investments are subject to market risks. Past performance does not guarantee future returns.