

SEBI RIA vs Mutual Fund Distributor: The Difference Every Indian Investor Must Understand
Your "financial adviser" may not be legally allowed to give you financial advice. Here is ...
23 June 2026

Finnovate’s editorial team researches and creates financial content using trusted sources, regulatory references and inputs from subject experts.
India's equity derivatives market became smaller in FY26.
Participation declined, new trader additions slowed sharply and millions of individuals who had traded in the previous year did not return.
Yet losses remained widespread.
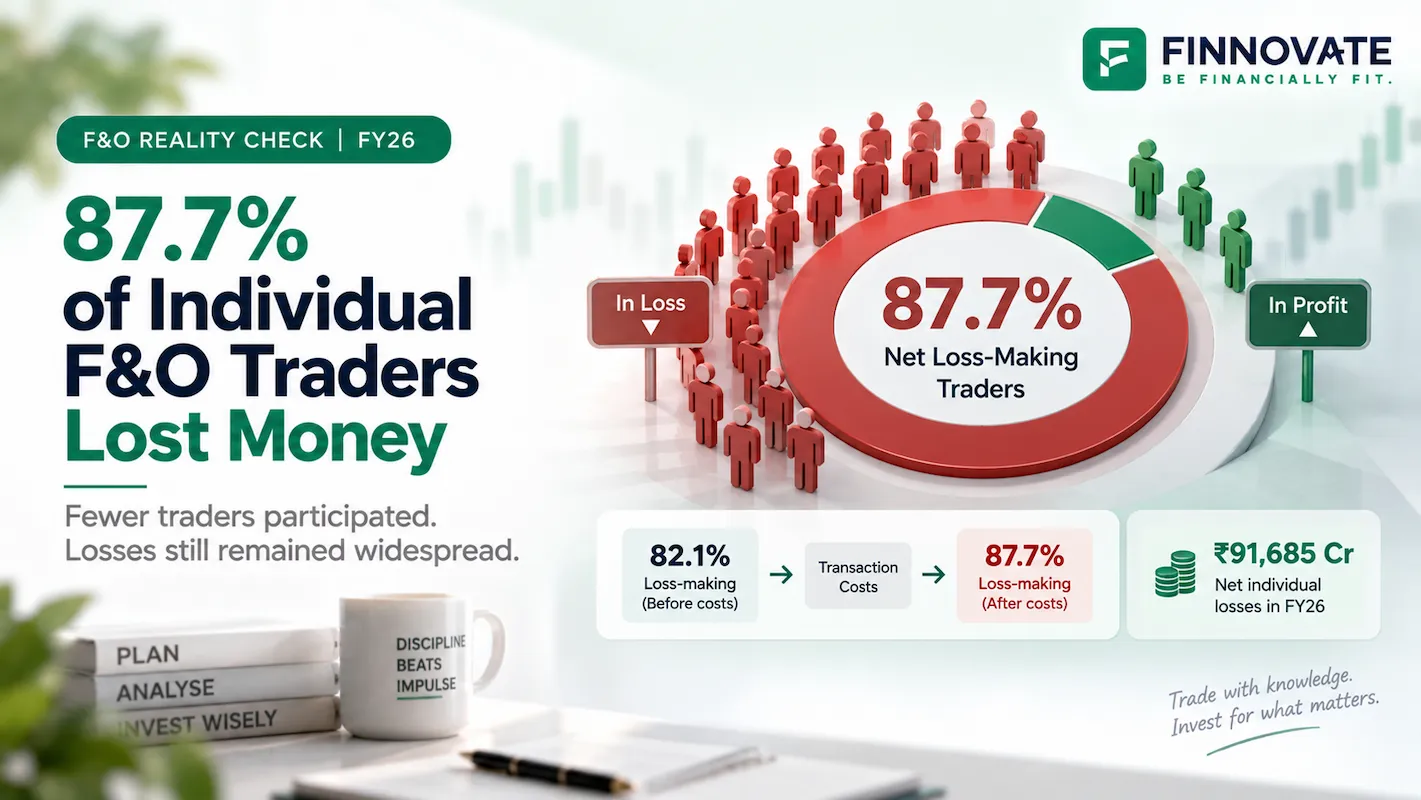
SEBI's latest study found that 87.7% of individual equity-derivatives traders incurred net losses in FY26.
Aggregate net losses stood at ₹91,685 crore, while the average net loss per trader increased to around ₹1.17 lakh.
SEBI's revised FY25 estimate puts individual net losses at ₹1,11,788 crore.
The scale of the loss is only one part of the story.
SEBI's data also shows how transaction costs affected profitability, how heavily individual activity was concentrated in options and short-expiry contracts, and which participant categories recorded gross trading gains.
Together, those numbers provide a clearer picture of how individual participation in India's F&O market changed during FY26.
Table of Contents
SEBI's FY25-FY26 studies show a clear reduction in individual participation in the equity derivatives segment.
| Metric | FY25 | FY26 |
|---|---|---|
| Active individual traders | 106.2 lakh | 87.5 lakh |
| New traders entering the segment | 34.3 lakh | 20.8 lakh |
| Traders exiting* | About 26 lakh | About 46 lakh |
| Loss-making individual traders | 90.9% | 87.7% |
| Aggregate net losses | ₹1,11,788 crore | ₹91,685 crore |
| Average net loss per trader | ~₹1.14 lakh | ~₹1.17 lakh |
Active individual participation declined by around 18%.
New trader additions fell by nearly 40%.
At the same time, exits increased sharply.
SEBI described the FY26 decline as a partial retrenchment from the rapid expansion seen after FY21, with the overall trader base still substantially above earlier levels.
Aggregate individual losses declined from approximately ₹1.12 lakh crore in FY25 to ₹91,685 crore in FY26.
That was a reduction of around 18%.
Individual participation also declined by roughly the same magnitude.
The average loss per trader moved in the opposite direction.
Average net loss per trader: approximately ₹1.14 lakh.
Average net loss per trader: approximately ₹1.17 lakh.
Among traders who actually ended the year with losses, SEBI reported an average loss of around ₹1.47 lakh.
Profit-making traders recorded an average profit of around ₹1.22 lakh.
SEBI defines derivatives as financial instruments whose value is derived from an underlying security or financial instrument.
Futures and options are the two major exchange-traded equity derivative products.
A futures contract creates an obligation to transact at a predetermined price and date.
An option gives the buyer a right, while the seller carries the corresponding contractual obligation if that option is exercised.
SEBI identifies three common uses of derivatives:
The payoff structure also differs from owning shares.
SEBI describes derivatives as a zero-sum structure before costs: gains and losses across opposing positions offset each other.
Equity ownership has a different economic base because shareholders own a stake in a business whose profits, cash flows and dividends can change over time.
SEBI's FY26 profitability study provides one of the clearest measures of the effect of trading costs.
Before transaction costs:
After transaction costs:
The difference represents traders whose gross trading result was positive or near break-even but moved into a net loss after trading costs.
Individual equity-derivatives traders incurred around ₹25,000 crore of transaction costs in FY26.
SEBI estimated a similar amount in FY25.
Across FY22 to FY26, cumulative transaction costs for individuals reached approximately ₹1 lakh crore.
These costs include components such as:
Brokerage accounted for roughly 44% of FY26 transaction costs, while STT accounted for around 27%.
SEBI also reported that STT paid by individual derivatives traders increased from about ₹1,291 crore in FY22 to ₹6,645 crore in FY26.
SEBI's study also breaks down gross trading profit and loss by participant category before transaction costs.
| Participant Category | Approx. FY26 Gross Trading P&L |
|---|---|
| Proprietary traders | +₹44,000 crore |
| Foreign Portfolio Investors | +₹14,000 crore |
| Corporates | +₹8,000 crore |
| Mutual Funds | +₹3,000 crore |
| Partnership firms / LLPs | +₹3,000 crore |
| Individuals | -₹72,000 crore |
SEBI also examined the role of algorithmic trading among professional participant categories.
About 99% of gross profits earned by FPI and proprietary-trading entities came from entities classified as algo entities, meaning the entity had placed at least one algorithmic order during the year.
These participant groups use derivatives across a range of activities including hedging, arbitrage, market-making, portfolio management and proprietary trading.
Individual participation in India's equity derivatives market was concentrated overwhelmingly in options.
Across FY25 and FY26:
In FY26, approximately 93.4% of individual traders traded only options.
Options also accounted for around 92% of aggregate individual derivatives losses.
SEBI found a material difference in the proportion of loss-making traders across the two main derivative products.
| Product | Approx. Share of Individual Traders Recording Losses in FY26 |
|---|---|
| Futures | ~66% |
| Options | 87.7% |
Options require an upfront premium from the buyer and can provide exposure to an underlying index or security with a smaller initial cash outlay than purchasing the underlying asset directly.
SEBI's investor guidance identifies leverage as one of the key risks in derivatives because gains and losses can be magnified relative to the amount initially committed.
The trading-behaviour study also examined when individual index-options turnover occurred relative to contract expiry.
In FY25, around 70% of index-options turnover occurred on expiry day.
In FY26, this declined to around 59%.
The broader concentration near expiry remained high.
| Time Remaining to Expiry | Share of FY26 Individual Index-Options Turnover |
|---|---|
| On expiry day | 59% |
| Within 1 day of expiry | 75% |
| Within 7 days of expiry | 97% |
| More than 7 days to expiry | 3% |
The data shows that individual index-options activity remained heavily concentrated in short-duration contracts.
SEBI compared individual derivatives participation with the size of traders' underlying equity portfolios.
Across FY25 and FY26, around 122.6 lakh individuals traded in equity derivatives.
Among them:
SEBI then examined traders with both:
This group represented approximately 13% of individual traders.
It accounted for around:
The data shows that derivatives turnover can be many times larger than the value of an individual's underlying equity holdings.
That gap is especially relevant because derivatives exposure is determined by contract value and position size rather than by the size of the investor's cash-market portfolio.
Younger traders continued to make up a large share of individual derivatives participation.
In FY26:
Among traders below age 30, approximately 88.6% recorded losses.
SEBI also analysed declared income for the subset of traders where income information was available.
About three-fourths of that group fell within the below-₹5 lakh annual income category.
Within this income group:
The income analysis applies to the subset of traders for whom income information was available in SEBI's dataset.
SEBI introduced a series of equity-derivatives measures beginning in late 2024.
These included:
FY26 subsequently recorded several changes in individual participation.
Active individual traders declined by around 18%.
New trader additions declined by nearly 40%.
Nearly 46 lakh previous-year traders did not participate in FY26.
Expiry-day index-options turnover fell from about 70% to 59%.
SEBI's study presents these as observed changes in participation and trading behaviour.
SEBI also states that the analysis is descriptive and does not establish causal relationships between every regulatory measure and every change observed in FY26.
Even after the reduction in participation, 87.7% of individual traders recorded net losses.
Equity investment and derivative trading both take place within securities markets, but the economic exposure is different.
An investor owns a share of an underlying company. Long-term outcomes are influenced by business earnings, cash flows, valuation and dividends.
A trader holds a contract whose value depends on an underlying asset and factors such as price movement, time to expiry, volatility and contract terms.
SEBI classifies derivatives as instruments used for hedging, speculation and arbitrage.
Leverage means a relatively small initial amount can create exposure to a substantially larger underlying value.
Options also contain a time component because contracts expire.
Transaction costs apply each time positions are created, adjusted or exited.
SEBI's latest studies give us a clearer picture of India's individual derivatives market after a year of lower participation.
Active individual traders declined.
New entries slowed sharply.
Aggregate net losses declined from around ₹1.12 lakh crore to ₹91,685 crore.
The average net loss per trader increased to around ₹1.17 lakh.
Transaction costs remained substantial at approximately ₹25,000 crore.
Options accounted for the overwhelming majority of individual participation and around 92% of aggregate individual losses.
Most index-options turnover remained concentrated within seven days of expiry.
Individuals collectively recorded gross trading losses of around ₹72,000 crore, while proprietary traders and FPIs recorded the largest gross gains among participant categories.
SEBI also found substantial derivatives turnover among traders with small or no underlying equity portfolios.
The FY26 data therefore provides a measurable distinction between market participation and profitable market participation.
For derivatives, the relevant outcome is the final net result after trading P&L and all transaction costs are accounted for.
SEBI found that 87.7% of individual equity-derivatives traders incurred net losses in FY26. The corresponding figure for FY25 was 90.9%.
Aggregate net losses were approximately ₹91,685 crore in FY26. SEBI's revised FY25 estimate was ₹1,11,788 crore, taking combined losses across FY25 and FY26 to roughly ₹2.03 lakh crore.
SEBI reported an average net loss of around ₹1.17 lakh per individual trader in FY26. Among traders who ended the year in loss, the average loss was approximately ₹1.47 lakh.
Individual equity-derivatives traders incurred approximately ₹25,000 crore in transaction costs in FY26. Cumulative transaction costs across FY22 to FY26 were around ₹1 lakh crore.
SEBI found that 82.1% of individual traders were loss-making before transaction costs. After transaction costs, the share increased to 87.7%.
Yes. Options accounted for approximately 92% of aggregate individual equity-derivatives losses in FY26. About 93.4% of individual derivatives traders traded only options during the year.
Before transaction costs, proprietary traders recorded approximately ₹44,000 crore of gross trading profits and FPIs around ₹14,000 crore. Individuals collectively recorded gross trading losses of approximately ₹72,000 crore.
SEBI identifies hedging, speculation and arbitrage as common uses of derivatives. Futures and options derive their value from an underlying security or financial instrument and can involve leveraged exposure.
Disclaimer: This article is for educational and informational purposes only. Futures and options are leveraged market instruments and involve substantial risk. The figures discussed are based on SEBI studies of historical individual trading activity in the equity derivatives segment and do not predict the outcome of future trades. Nothing in this article should be treated as investment, trading or derivatives advice.
No spam. Only new posts, simple explainers, and practical money checklists for busy professionals.
Finnovate is a SEBI-registered financial planning firm that helps professionals bring structure and purpose to their money. Over 3,500+ families have trusted our disciplined process to plan their goals - safely, surely, and swiftly.
Our team constantly tracks market trends, policy changes, and investment opportunities like the ones featured in this Weekly Capsule - to help you make informed, confident financial decisions.
Learn more about our approach and how we work with you:
No comments yet. Start the conversation. What would you add?
No spam. Only new posts, simple explainers, and practical money checklists.
You may also like
Your "financial adviser" may not be legally allowed to give you financial advice. Here is ...

Warren Buffett retires at 95, leaving behind more than iconic returns. Here’s how discip...

Discover 10 powerful habits that can help you achieve financial freedom - no matter your i...

Looking for the best financial freedom books? Here’s a handpicked 2026 reading list with...
Popular now

Learn how to easily download your NSDL CAS Statement in PDF format with our step-by-step g...
Looking for the best financial freedom books? Here’s a handpicked 2026 reading list with...

Learn what SIF investment means in India, SEBI rules, Rs 10 lakh minimum investment, avail...

Clear guide to mutual fund taxation in India for FY 2025–26 after July 2024 changes: equ...