India CPI Inflation October 2026 Rises to 6.09%; Food Inflation Hits 8.94%

Finnovate’s editorial team researches and creates financial content using trusted sources, regulatory references and inputs from subject experts.
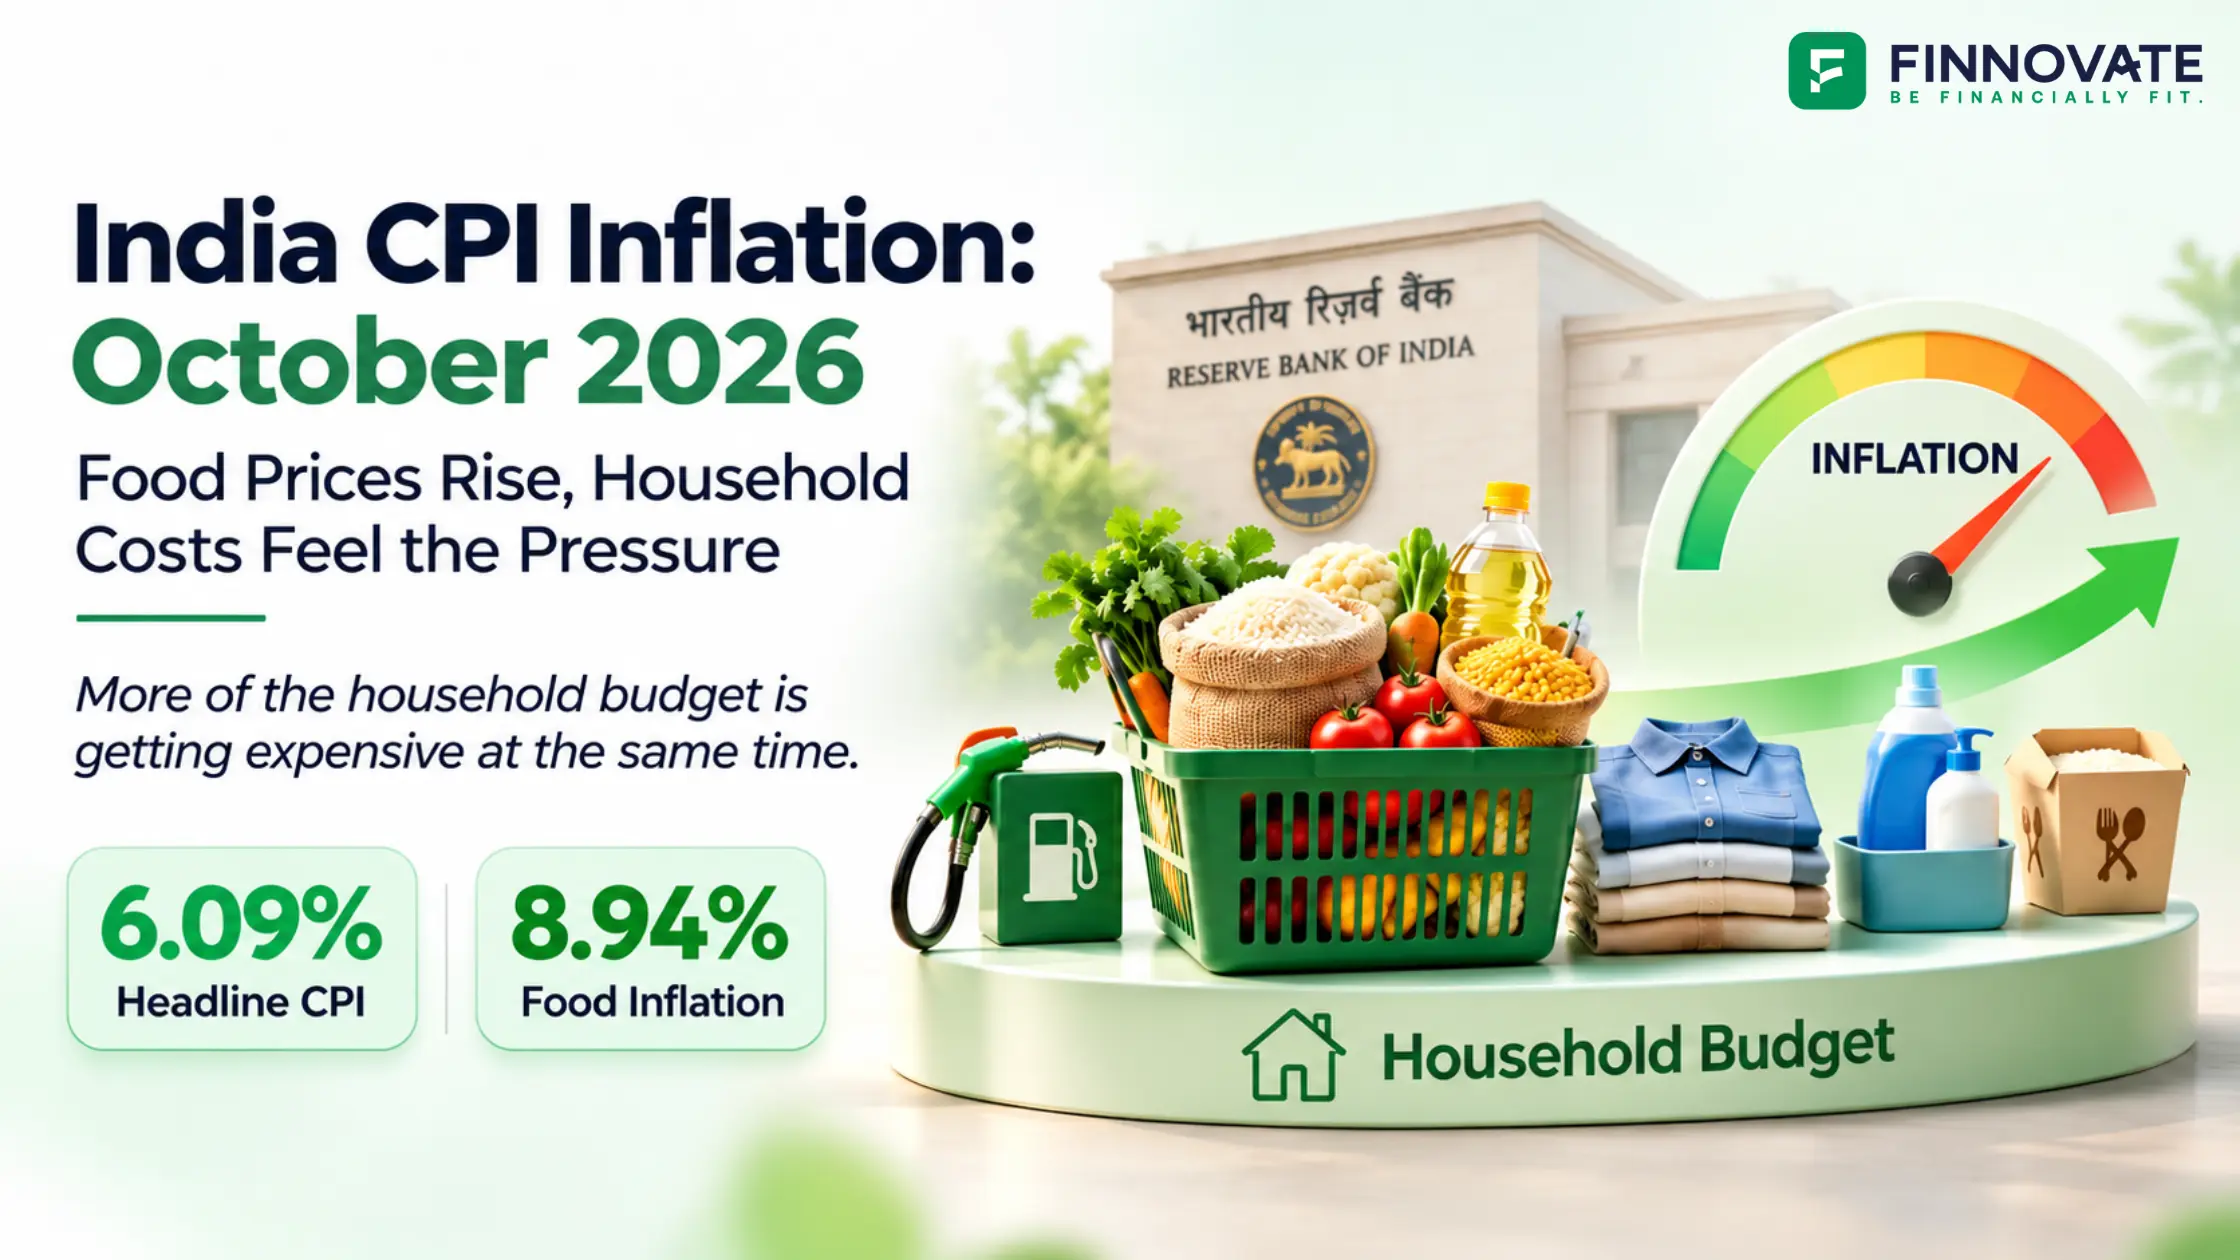
India’s retail inflation rose to 6.09% in October 2026, up from 5.54% in September, as food prices increased faster. Food inflation reached 8.94%, compared with 7.74% a month earlier.
The figures, released on November 12, show a widening gap between rural and urban inflation. Rural households faced headline inflation of 6.63%, while the urban reading stood at 5.41%. October’s figures are provisional.
Food remained a major source of pressure, but the increase extended across several spending categories. Clothing, transport, furnishings and restaurant services all recorded higher annual inflation than in September.
For households, this puts pressure on both everyday essentials and other regular expenses. For businesses, it raises questions about costs, pricing and how much customers have left to spend.
October 2026 CPI Inflation: Full Category-Wise Comparison
The table below compares annual inflation across all 12 CPI divisions, alongside food inflation and the overall headline rate.
| CPI category | August 2026 | September 2026 | October 2026 |
|---|---|---|---|
| Food and beverages | 5.68% | 7.36% | 8.51% |
| Paan, tobacco and intoxicants | 4.67% | 4.80% | 4.93% |
| Clothing and footwear | 3.56% | 3.93% | 4.96% |
| Housing, water, electricity, gas and other fuels | 2.62% | 2.74% | 2.90% |
| Furnishings, household equipment and routine household maintenance | 2.68% | 3.11% | 3.94% |
| Health | 1.33% | 1.40% | 2.05% |
| Transport | 4.61% | 5.01% | 5.84% |
| Information and communication | 2.00% | 2.44% | 3.16% |
| Recreation, sport and culture | 1.73% | 2.16% | 2.52% |
| Education services | 3.74% | 3.94% | 4.02% |
| Restaurants and accommodation services | 8.38% | 9.36% | 10.06% |
| Personal care, social protection and miscellaneous goods and services | 15.15% | 13.75% | 10.14% |
| Food inflation: CFPI | 5.97% | 7.74% | 8.94% |
| Headline inflation: CPI | 4.83% | 5.54% | 6.09% |
Scroll horizontally to view the full table.
Source: MoSPI CPI releases and RBI’s October 2026 statistical table. All figures are year-on-year rates under the 2024=100 series. August division figures reflect the later RBI publication; September division figures are from the September release. September headline and CFPI readings were confirmed as final in the October release. October figures are provisional.
The comparison shows higher annual inflation in 11 of the 12 divisions between September and October. The exception was the broad personal-care and miscellaneous division.
This breadth matters. A household may be able to absorb a temporary increase in one expense by spending less elsewhere. That adjustment becomes harder when several regular expenses rise together.
Food Inflation Accelerates Further
Food inflation rose by 1.20 percentage points, or 120 basis points, between September and October. Since August, it has increased by 2.97 percentage points.
Food spending is difficult to postpone. Households can change brands, buy smaller quantities or substitute ingredients, but there is a limit to how much they can cut.
This also affects spending beyond groceries. When essentials absorb more income, families may delay purchases such as clothing, appliances or a vehicle.
The table contains two related food measures. CFPI tracks food, while the food-and-beverages division also includes beverages and services for processing primary food goods. Their different coverage produces different inflation readings.
For businesses, the impact depends on their position in the supply chain. Higher selling prices may support revenue, but higher ingredient costs can squeeze margins when customers resist further price increases.
Which Items Recorded the Sharpest Price Changes?
The October release highlights wide differences between individual items.
| Items with high annual inflation | October 2026 | Items with negative annual inflation | October 2026 |
|---|---|---|---|
| Onion | 116.22% | Potato | −14.24% |
| Garlic | 60.74% | Cauliflower | −10.57% |
| Silver jewellery | 52.39% | Coconut | −5.60% |
| Ginger | 48.32% | Brinjal | −3.34% |
| Lemon | 47.30% | Cabbage | −1.92% |
Scroll horizontally to view the full table.
Source: MoSPI, October 2026 CPI release. Figures compare prices with October 2025. Negative readings indicate lower prices than a year earlier.
These changes help explain why individual grocery bills can look very different from the national average. A household buying more of the items with sharp increases will feel greater pressure.
Each item also has a different weight in the CPI basket. Its effect on headline inflation depends on both that weight and its price movement. A striking percentage increase in a small category can have less influence than a moderate rise across a large spending category.
Rural Inflation Remains Higher, but Urban Food Inflation Picks Up Faster
The rural–urban breakdown shows pressure across both groups.
| Inflation measure | September 2026 | October 2026 |
|---|---|---|
| Rural headline inflation | 6.08% | 6.63% |
| Urban headline inflation | 4.88% | 5.41% |
| Rural food inflation | 8.06% | 9.09% |
| Urban food inflation | 7.18% | 8.68% |
Scroll horizontally to view the full table.
Source: MoSPI. September figures are final; October figures are provisional. All readings are year-on-year inflation rates.
Rural headline inflation exceeded urban inflation by 1.22 percentage points in October. However, urban food inflation increased faster during the month: 1.50 percentage points, against 1.03 percentage points in rural areas.
The impact on each family will depend on its spending pattern and income growth. Households with little room in their budgets face a more difficult adjustment when essential costs rise faster than earnings.
What the Broader Basket Shows
The three-month comparison reveals two developments.
First, price pressure has spread across regular spending categories. Clothing, household goods, transport and communication all show higher inflation than in August. For consumers, this can make the squeeze feel broader than the grocery bill alone.
Second, inflation eased in the personal-care, social-protection and miscellaneous division, although its annual rate remained in double digits.
A lower inflation rate means prices are rising more slowly relative to the previous year. Whether prices actually fell during the latest month requires a comparison of the monthly price indices.
This distinction matters when judging relief for household budgets. Slower price growth can help, but families still need income growth to catch up with the higher level of spending.
What Does October Inflation Mean for RBI Policy?
The RBI raised the repo rate by 25 basis points to 5.50% on October 7, 2026. It also adopted a calibrated-tightening stance, linking further action to the evolving growth and inflation outlook. The next scheduled policy meeting is December 2–4, 2026.
October’s higher inflation adds pressure to that assessment.
Food supply problems can respond to better harvests, improved distribution or imports. Interest rates work through a different channel, influencing credit, spending and demand.
For the RBI, the concern is whether price increases persist and spread through wages, business costs and inflation expectations. At the same time, tighter borrowing conditions can slow investment and consumption.
For borrowers and investors, the practical focus is therefore on how persistent inflation becomes and how the RBI responds. Changes in lending rates, deposit rates and bond yields will also depend on market expectations and financial conditions.
FAQs
1. What is India’s CPI inflation rate for October 2026?
India’s headline CPI inflation was 6.09% in October 2026, compared with 5.54% in September. October’s reading is provisional and measures the annual change in consumer prices.
2. How is food inflation different from headline inflation?
Food inflation measures price changes within the food basket. Headline inflation covers the wider consumer basket, including housing-related costs, clothing, health, transport, education and other goods and services.
3. Was rural or urban inflation higher in October 2026?
Rural inflation was higher at 6.63%, compared with 5.41% in urban areas. Rural food inflation also remained higher, although urban food inflation increased more sharply from September.
Sources
Disclaimer: This article is for information and education only and is not a recommendation to buy or sell any investment. Provisional economic data may be revised.