

FPI Flows First Half October 2026: ₹47,955 Crore Outflow
Explore FPI equity flows for October First Half, 2026: ₹47,955 crore in net outflows, th...
23 October 2026

Last reviewed: May 2026
FPI equity selling in the first fortnight of May 2026 came in at $2.82 billion, meaningfully lower than the $5 billion-plus pace seen in the first fortnights of March and April. The pace is slowing, but the selling has not stopped.
The composition of the selling tells a more important story than the headline number: BFSI at $1.87 billion and Oil and Gas at $718 million accounted for nearly 92% of the net outflow. Most other sectors were in marginal outflow or close to flat.
The Indian rupee touched a record low near ₹96.34 per dollar during the second week of May, extending its year-to-date fall to approximately 7% from ₹89 at the start of 2026. FPI equity AUC (assets under custody) fell further to $702 billion, and overall FPI AUC including debt fell to $775 billion, both well below the September 2024 peaks.
| Sector (NSDL Template) | Equity Flows ($M) | Sector (NSDL Template) | Equity Flows ($M) |
|---|---|---|---|
| Services | +732 | Chemicals | -73 |
| Capital Goods | +276 | Others | -84 |
| Metals and Mining | +177 | Construction | -103 |
| Diversified | +3 | Consumer Durables | -121 |
| Media and Entertainment | -1 | Power | -121 |
| Utilities | -3 | Construction Materials | -126 |
| Forest Materials | -4 | Fast Moving Consumer Goods | -169 |
| Textiles | -12 | Information Technology | -171 |
| Automobile and Components | -37 | Telecommunication | -265 |
| Consumer Services | -38 | Oil and Gas | -718 |
| Healthcare | -44 | Financial Services (BFSI) | -1,872 |
| Realty | -45 | Grand Total | -2,819 |
Four structural factors are keeping FPIs in net selling mode despite the reduced pace.
The geopolitical situation in West Asia has eased at the margins, but India faces a compounding problem: even Russian crude, which had been available at a discount, has seen prices rise. With the Strait of Hormuz still in a state of flux, supply chains for oil, gas, and oil derivatives remain under stress. India imports over 85% of its crude requirements, and the cost pressure is geopolitically driven rather than market-cyclical.
The reduction in MSCI India weightage, combined with the outperformance of Taiwan and South Korea linked to their AI hardware companies, has created a structural reallocation dynamic. FPI capital at the Asia level is moving toward markets with a clearer AI infrastructure narrative. India is not currently part of that narrative, which means the reallocation pressure is not temporary.
The rupee at record lows near ₹96.34 per dollar is itself a deterrent to fresh FPI inflows. A foreign investor who bought Indian equities at ₹89/$ and faces a rupee now at ₹96/$ has already absorbed approximately 8% of currency loss before their equity position has moved at all. Until the rupee shows credible signs of stabilising, the currency risk premium on Indian equities remains elevated.
FPIs are not yet clear on how the RBI will respond to the twin challenges of rising inflation and a weakening rupee. A rate hike would support the rupee but could slow growth. Staying on hold risks further inflation pass-through and continued rupee pressure. This policy ambiguity is priced into reduced FPI exposure to India.
BFSI remained the largest source of FPI outflows for the month. It has been the most persistent target across multiple fortnights. The sector is large-cap, liquid, and the easiest to exit at scale.
BFSI also carries direct exposure to the two factors FPIs are most uncertain about: the RBI's monetary policy direction, and rupee stability affecting loan books with foreign currency borrowings. When FPIs want to reduce India exposure quickly and at size, BFSI is the most practical exit.
Oil and gas stocks saw heavy FPI selling on fears that rising crude prices would widen the subsidy gap for downstream companies. If the government holds retail petrol and diesel prices stable in a high-crude environment, the subsidy burden on oil marketing companies increases and their profitability deteriorates.
The FPI investment thesis for oil and gas equities weakens when fuel prices are politically managed rather than market-linked. The selling in this sector reflects a specific margin compression concern, not just general India risk-off.
Telecom selling was significant in absolute terms, but the FPI motivation is more company-specific than sector-bearish. The selling is largely attributed to FPIs reducing exposure to Bharti Airtel ahead of the share swap of Airtel Africa shares. This is a corporate event-driven adjustment rather than a structural sector exit.
The combined selling in defensives is a qualitative signal worth noting. FPIs are not just selling cyclicals exposed to economic slowdown. They are also reducing positions in sectors that are supposed to be resilient.
IT faces the AI disruption concern for services revenue. FMCG and consumer durables face purchasing power erosion as inflation hits urban and rural households. The valuation case for defensives is weak when FPIs already hold a negative view on the economy's near-term trajectory.
Services was the standout inflow sector. Services companies, particularly financial services enablers, business process management, and platform businesses, are less exposed to trade constraint headwinds than manufacturing or commodity sectors.
Their revenue is more domestic or services-export oriented, which provides insulation from crude prices, supply chain disruption, and Strait of Hormuz-related uncertainty.
Capital goods saw continued FPI inflows driven by two factors: the revival in domestic investment spending, and rebuilding demand from Gulf countries. As Gulf economies repair infrastructure affected by the regional conflict, Indian capital goods manufacturers are among the beneficiaries. This is a counter-cyclical positive within an otherwise negative FPI flow month.
Every sector in outflow has a specific reason: BFSI exits on RBI and currency uncertainty, Oil and Gas exits on subsidy gap risk, IT exits on AI disruption concerns. When selling has structural reasons, it takes structural changes to reverse it.
The conditions for reversal across these three sectors are: RBI policy clarity, a credible fuel pricing reform signal, and an India AI narrative. None of these is imminent, which explains why the selling pace has slowed but not reversed.
Equity market direction in India in the near term will be significantly influenced by where the rupee goes. A rupee stabilisation at ₹96 or any credible reversal toward ₹93-94 would reduce the currency risk premium that FPIs are applying to Indian equities and could trigger a partial flow reversal.
The RBI's June 3-5, 2026 MPC meeting is the next potential inflection point for currency and rate sentiment.
In a broadly negative FPI flow environment, the sectors receiving inflows are worth noting. Services companies with domestic or services-export revenue, and capital goods companies with Gulf rebuilding exposure, are the two clusters where FPIs are adding rather than reducing.
This is not investment advice. Please consult a SEBI-registered investment adviser before making any portfolio decisions.
BFSI, IT, and FMCG are among the heaviest-sold sectors by FPIs in 2026. Whether your equity allocation has meaningful exposure to these sectors, and whether that exposure is sized for the current environment, is worth a 30-minute review.
Book a free callThe March and April first fortnights each saw over $5 billion in FPI equity selling, partly driven by the initial shock of crude price spikes and rupee depreciation. By May, much of the initial repositioning had been completed. Sellers who wanted to exit had largely done so in earlier months. The slowing pace reflects a lower rate of incremental exit rather than any fresh buying conviction.
BFSI is the largest weight in Indian indices, the most liquid sector, and the easiest to exit at scale. It also carries direct exposure to the two factors FPIs are most uncertain about: the RBI's monetary policy direction and rupee stability affecting loan books with foreign currency borrowings. When FPIs want to reduce India exposure quickly and at size, BFSI is the most practical exit point.
Higher crude prices help upstream exploration companies but hurt India's downstream oil marketing companies like HPCL, BPCL, and Indian Oil. If the government keeps retail petrol and diesel prices stable in a high-crude environment for political reasons, the subsidy gap widens and OMC profitability suffers. FPIs are pricing in this subsidy risk rather than the crude price upside.
A slower pace of selling does not automatically signal a reversal. The structural factors driving FPI exits, namely the rupee at record lows, the absence of an India AI narrative, MSCI weight reduction, and crude cost pressure, remain in place. A reversal requires one or more of these to change materially. Past FPI flow patterns are not indicative of future flows.
Please consult a SEBI-registered investment adviser before making any portfolio decisions based on FPI flow data.
When FPIs sell Indian equities and repatriate the proceeds, they sell rupees and buy foreign currency, typically US dollars. This creates additional dollar demand and rupee supply in the currency market, putting downward pressure on the rupee. In May 2026, this mechanism is reinforcing itself: FPI selling weakens the rupee, which reduces dollar-adjusted returns for remaining FPI holders, giving them an additional reason to sell. This feedback loop makes rupee stabilisation critical to breaking the FPI selling cycle.
Disclaimer: This article is for general information and educational purposes only. It does not constitute investment advice, a recommendation, or an offer to buy or sell any securities or financial instruments. FPI flow data sourced from NSDL. Rupee level data sourced from Business Standard/Bloomberg and EBC Financial Group reporting for May 2026. All figures are approximate and subject to revision. Past FPI flow patterns and market behaviour are not indicative of future outcomes. No investment decision should be made based solely on the contents of this article. Please consult a SEBI-registered investment adviser or qualified financial professional before making any investment decision. Equity investments are subject to market risks.
No spam. Only new posts, simple explainers, and practical money checklists for busy professionals.
Finnovate is a SEBI-registered financial planning firm that helps professionals bring structure and purpose to their money. Over 3,500+ families have trusted our disciplined process to plan their goals - safely, surely, and swiftly.
Our team constantly tracks market trends, policy changes, and investment opportunities like the ones featured in this Weekly Capsule - to help you make informed, confident financial decisions.
Learn more about our approach and how we work with you:
No comments yet. Start the conversation. What would you add?
No spam. Only new posts, simple explainers, and practical money checklists.
You may also like
Explore FPI equity flows for October First Half, 2026: ₹47,955 crore in net outflows, th...

Understand the India–Mauritius tax treaty’s Principal Purpose Test, its August 2026 ef...

Explore India’s AI hardware opportunity through the proposed Adani–Jabil venture, from...
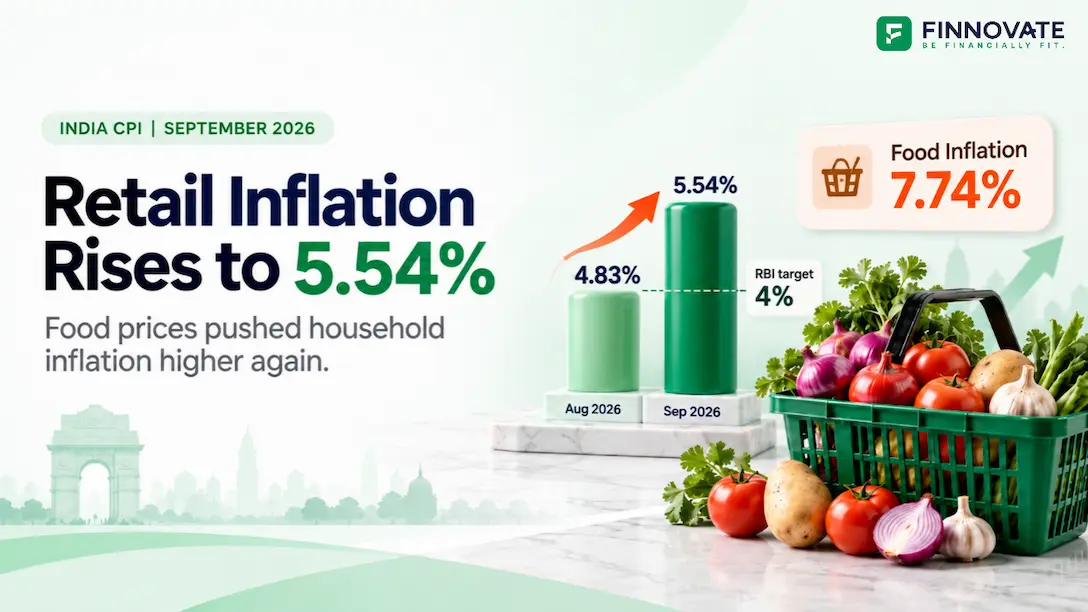
India’s CPI inflation rose to 5.54% in September 2026. Compare monthly trends, food pric...
Popular now

Learn how to easily download your NSDL CAS Statement in PDF format with our step-by-step g...

Looking for the best financial freedom books? Here’s a handpicked 2026 reading list with...

Learn what SIF investment means in India, SEBI rules, Rs 10 lakh minimum investment, avail...

Clear guide to mutual fund taxation in India for FY 2025–26 after July 2024 changes: equ...