Equity Mutual Fund Flows October 2026: Where Did Investors Put Their Money?

Finnovate’s editorial team researches and creates financial content using trusted sources, regulatory references and inputs from subject experts.
Equity mutual fund inflows slowed in October. But one category attracted almost twice the money it received a month earlier.
Large & mid-cap funds drew ₹8,484.23 crore in net inflows, up from ₹4,271.22 crore in September. That put them ahead of small-cap, mid-cap and flexi-cap funds for the month.
Across active equity categories, net inflows fell 13.9% to ₹32,993.64 crore. October therefore brought a change in where money was being allocated, even as overall net investment moderated.
Large & mid-cap funds also led on two relative measures: net inflows as a share of gross subscriptions, and net inflows compared with the category’s assets. Together, these measures offer a fuller view of October’s flows than the rupee totals alone.
October Equity Fund Flows: The Overall Picture
Active equity funds received ₹65,581.36 crore in gross subscriptions during October. Redemptions of ₹32,587.72 crore left net inflows of ₹32,993.64 crore.
For every ₹100 subscribed during the month, approximately ₹50.31 remained after offsetting category-wide redemptions.
September’s corresponding figure was ₹51.19. The balance between subscriptions and redemptions changed only slightly, even though the volume of fresh subscriptions declined.
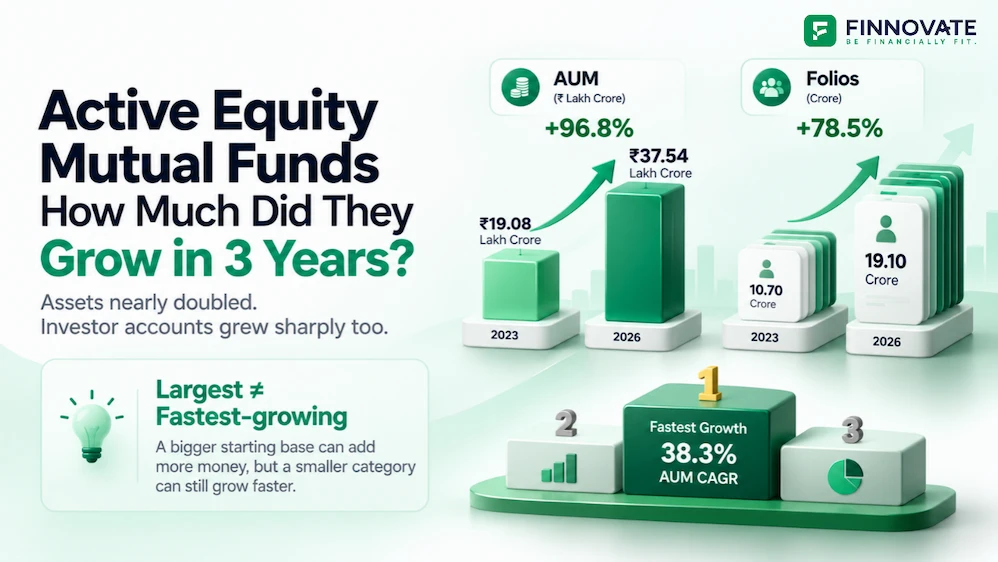
Month-end active equity AUM stood at ₹37.15 lakh crore, compared with ₹37.54 lakh crore in September. Positive net inflows can accompany a fall in AUM because portfolio values also move with markets.
For the longer-term change in category assets, see our equity mutual fund AUM growth comparison for October 2026, covering six months, one year and three years.
The category breakdown shows where October’s net additions were strongest.
How the Combined Flow Rank Score Is Calculated
Let’s compare the categories using two ratios, giving each equal weight:
- Net/Gross Flows: Net inflows divided by gross subscriptions. A higher percentage shows a larger net addition after accounting for redemptions.
- Net Flows/AUM: Net inflows divided by month-end AUM. This measures the size of the monthly addition relative to the category’s assets.
- Separate rankings: Categories are ranked from highest to lowest on each ratio, using the underlying calculations before rounding.
- Combined score: The two ranks are averaged. A lower score indicates a stronger position across these flow measures.
The score compares monthly category flows. Returns, portfolio risk, costs and fund-manager performance are outside its scope.
Equity Mutual Fund Flows: Full Category Comparison
| Equity Fund Category |
Gross Flows (₹ Crore) |
Net Flows (₹ Crore) |
Month-End AUM (₹ Crore) |
Net/Gross Flows |
Net Flows/ AUM |
Combined Flow Rank Score |
|---|---|---|---|---|---|---|
| Large & Mid-Cap Fund | 10,996.93 | 8,484.23 | 3,55,311.15 | 77.15% | 2.39% | 1.00 |
| Contra Fund | 2,524.96 | 1,694.13 | 72,471.70 | 67.10% | 2.34% | 2.00 |
| Small-Cap Fund | 10,254.72 | 6,407.50 | 4,40,874.57 | 62.48% | 1.45% | 3.00 |
| Multi-Cap Fund | 5,023.61 | 2,977.86 | 2,43,406.37 | 59.28% | 1.22% | 4.00 |
| Mid-Cap Fund | 9,001.39 | 4,892.62 | 5,03,433.67 | 54.35% | 0.97% | 5.00 |
| Flexi-Cap Fund | 9,958.29 | 4,979.95 | 5,91,363.72 | 50.01% | 0.84% | 6.00 |
| Focused Fund | 2,290.58 | 925.35 | 1,80,369.09 | 40.40% | 0.51% | 7.00 |
| Value Fund | 1,434.84 | 556.22 | 1,36,702.46 | 38.77% | 0.41% | 8.00 |
| Sectoral Fund | 2,491.10 | 551.59 | 1,47,816.36 | 22.14% | 0.37% | 9.50 |
| Large-Cap Fund | 4,338.74 | 1,032.39 | 3,93,541.43 | 23.79% | 0.26% | 10.00 |
| Thematic Fund | 5,999.57 | 1,162.48 | 3,90,452.71 | 19.38% | 0.30% | 10.50 |
| ELSS / Tax Saver Fund | 964.29 | -577.88 | 2,28,711.73 | -59.93% | -0.25% | 12.50 |
| Dividend Yield Fund | 302.34 | -92.82 | 30,095.48 | -30.70% | -0.31% | 12.50 |
| Total Active Equity Funds | 65,581.36 | 32,993.64 | 37,14,550.45 | 50.31% | 0.89% | N.A. |
Scroll horizontally to view the full table.
Source: AMFI. Flows cover October 2026; AUM is as of October 31, 2026. Ratios and combined scores are calculated from the reported figures. Published category figures may differ marginally from totals because of rounding. The combined flow rank score is an analytical comparison, not an AMFI fund rating.
Large & Mid-Cap Funds Lead on Both Measures
Large & mid-cap funds ranked first on both ratios, producing a combined score of 1.00.
Their 77.15% net-to-gross flow ratio means redemptions offset a relatively small part of October’s subscriptions. Net inflows also amounted to 2.39% of month-end assets, the highest proportion among the categories covered.
The September comparison adds weight to that result. Gross subscriptions increased while redemptions declined, helping net inflows rise 98.64% month on month.
That combination is stronger than a rise in subscriptions alone. More money entered the category, and less money left.
Whether this becomes a lasting allocation pattern will depend on the coming months. October itself gives large & mid-cap funds a clear lead in both absolute net inflows and the combined flow ranking.
Contra, Small-Cap and Multi-Cap Funds Follow
Contra funds ranked second despite receiving a much smaller rupee inflow than several larger categories.
Their ₹1,694.13 crore net addition was substantial relative to a ₹72,471.70 crore asset base. This produced a 2.34% net-flows-to-AUM ratio, close to the leading category’s 2.39%.
October also included the launch of ICICI Prudential Contra Fund, whose NFO closed on October 12 and allotment took place on October 15. New launches can influence a category’s monthly flow pattern, so this is relevant context for the contra result.
Small-cap funds placed third. They received ₹6,407.50 crore in net inflows, with a net-to-gross ratio of 62.48%.
Multi-cap funds followed with a score of 4.00. Their ₹2,977.86 crore net inflow represented 1.22% of month-end AUM.
These categories reached the top four through different combinations of size and relative flows. The ranking gives smaller categories room to stand alongside larger ones when their net additions are meaningful relative to their assets.
Mid-Cap and Flexi-Cap Funds Still Attract Substantial Money
Mid-cap and flexi-cap funds occupied fifth and sixth place.
Flexi-cap funds attracted slightly more net money in rupee terms. Mid-cap funds ranked higher because their net inflows represented a larger share of both gross subscriptions and category AUM.
A larger rupee inflow can still be a smaller addition relative to the assets already managed.
Focused and value funds followed in seventh and eighth place. Both recorded positive net inflows, but redemptions absorbed a larger share of subscriptions than in the leading categories.
These positions describe October’s flow balance. They provide no direct evidence that the underlying investment strategies have become more or less effective.
Large-Cap, Sectoral and Thematic Funds Face Larger Redemption Offsets
Large-cap funds received more than ₹1,000 crore in net inflows, yet placed tenth on the combined score.
Their asset base was large, and redemptions absorbed much of the month’s gross subscriptions. As a result, the net addition represented just 0.26% of AUM.
Sectoral and thematic funds showed a similar pattern of substantial subscriptions being offset by withdrawals. Their net-to-gross ratios were 22.14% and 19.38%, respectively.
Thematic funds therefore retained a relatively small net addition after category-wide redemptions, despite attracting almost ₹6,000 crore in gross subscriptions.
Monthly totals cannot reveal whether those withdrawals reflected profit-taking, rebalancing, cash needs or disappointment with returns. The measurable result is that the net additions were modest relative to the money subscribed.
ELSS and Dividend Yield Funds Record Net Outflows
ELSS funds recorded net outflows of ₹577.88 crore, while dividend yield funds saw ₹92.82 crore leave on a net basis.
Both ratios turn negative when redemptions exceed subscriptions.
ELSS had the weaker net-to-gross ratio, while dividend yield funds had the larger outflow relative to AUM. Their positions reversed across the two rankings, leaving both with an average score of 12.50.
The shared score therefore brings together two different flow patterns. ELSS faced a larger redemption imbalance relative to subscriptions; dividend yield funds experienced a larger proportional reduction relative to their asset base.
What October’s Flows Show
October combined continued net investment in active equity funds with a sharp rise in large & mid-cap allocations.
That category led on all three counts: the largest net inflow, the highest net-to-gross flow ratio and the highest net inflow relative to AUM.
Contra, small-cap and multi-cap funds also recorded strong relative additions. Further down the table, subscriptions continued across categories, but withdrawals absorbed a greater share.
The next monthly reports will show whether large & mid-cap funds sustain this lead. For October, their stronger subscriptions and lower redemptions made them the standout category.
FAQs
1. What were equity mutual fund net inflows in October 2026?
Active open-ended equity mutual funds recorded net inflows of ₹32,993.64 crore in October 2026, down 13.9% from September. This total covers the equity categories in the table; equity index funds and ETFs are reported separately by AMFI.
2. What is the difference between gross flows and net flows?
Gross flows represent money subscribed during the month. Net flows are subscriptions minus redemptions. A category can receive substantial gross inflows while recording net outflows if withdrawals are larger.
3. What does the combined flow rank score measure?
The score averages each category’s rank on two ratios: net flows divided by gross flows, and net flows divided by month-end AUM. A lower score indicates stronger relative monthly flows. It is not a ranking of investment returns or suitability.
4. Why are some flow ratios negative?
A negative ratio arises when redemptions exceed subscriptions. October’s ELSS and dividend yield categories recorded this pattern. The percentages measure net withdrawals relative to subscriptions or AUM, rather than losses in investment value.
Disclaimer: This article is for general information and education only and is not a recommendation to invest in any mutual fund or category. Flow rankings do not predict future returns. Mutual fund investments are subject to market risks. Read all scheme-related documents carefully.