
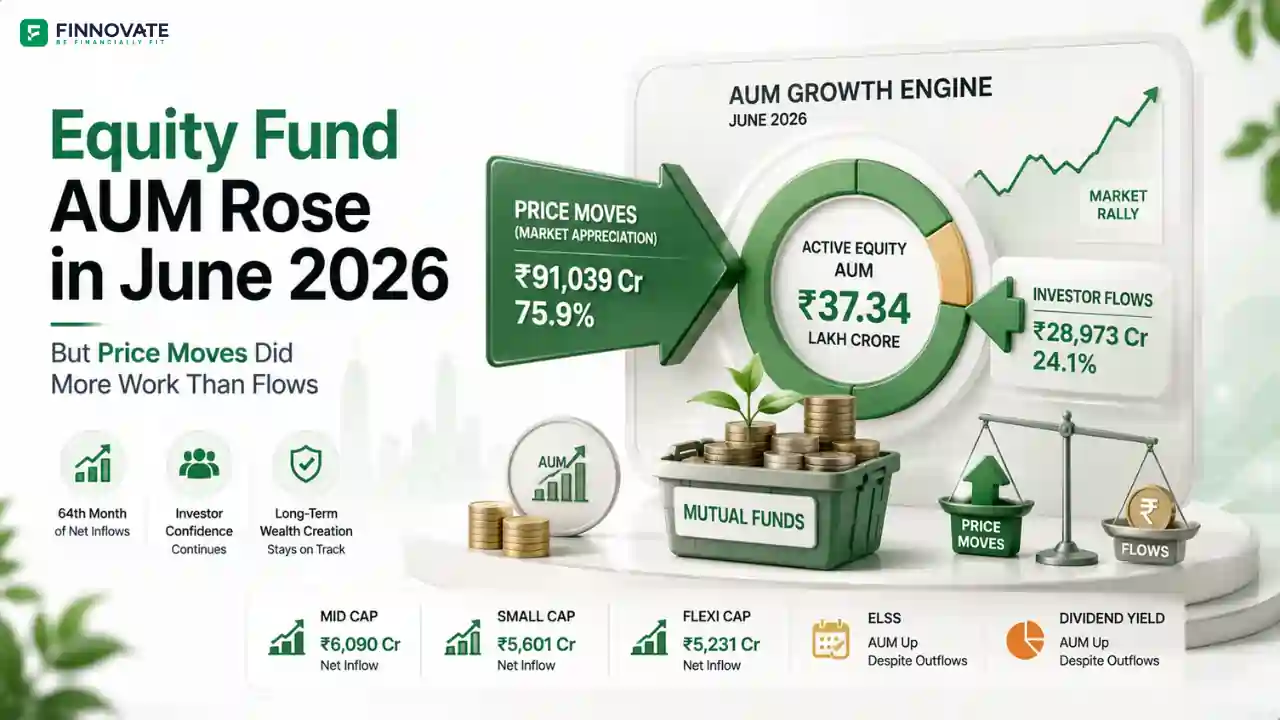
Equity Fund AUM June 2026: Price Moves Did More Work Than Flows
Active equity fund AUM rose 3.3% to ₹37.34 lakh crore in June 2026. Price accretion of �...
15 July 2026
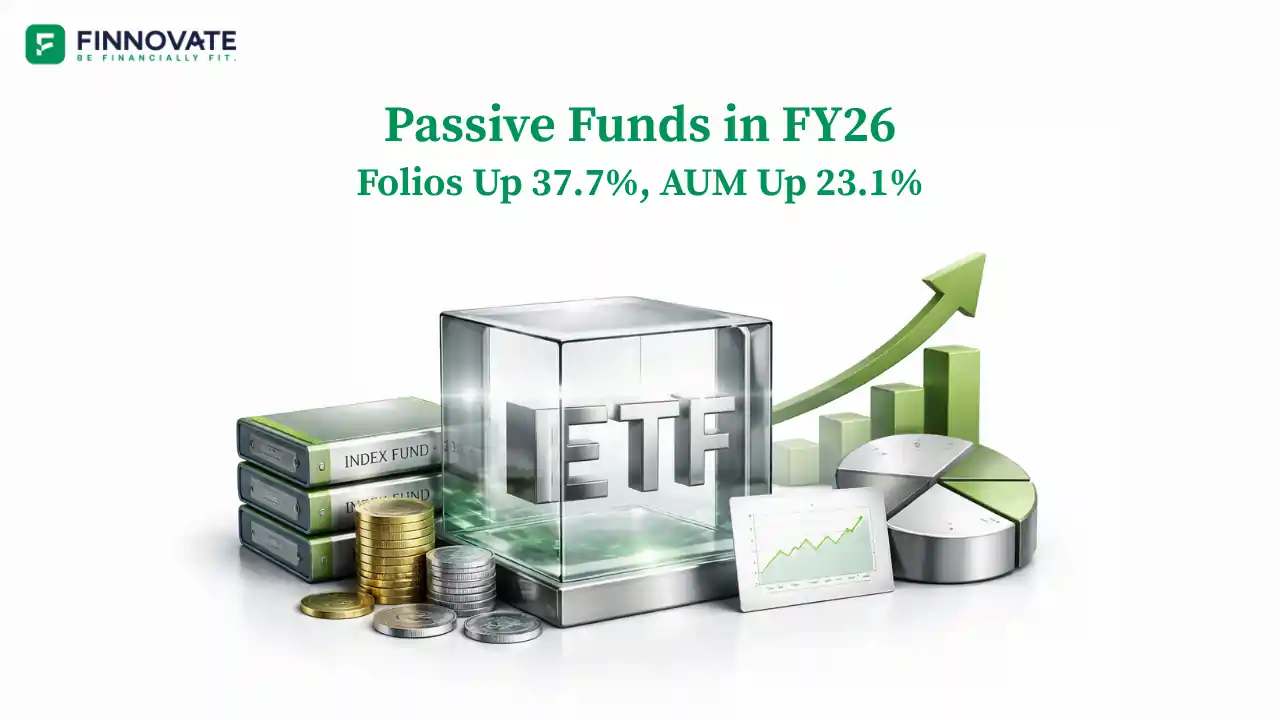
Passive funds entered FY26 as a growing segment of India's mutual fund industry. They exited it as a structurally entrenched one. By March 31, 2026, the passive category held ₹14.11 lakh crore in assets across 5.71 crore folios and 12 sub-categories.
Two stories drove FY26's passive expansion. The first was a clear investor preference for equity index funds and ETFs as a cost-effective route to large-cap exposure. The second was a surge in retail adoption of gold and silver ETFs, with folio counts growing at a scale that points to genuine asset diversification rather than tactical price bets.
This article presents the complete AMFI data on passive fund folios, AUM, and flows for FY26, with a category-by-category breakdown of what drove growth.
| Passive Fund Category | Mar-26 Folios | YOY (%) | Mar-26 AUM (₹ cr) | YOY (%) | Mar-26 Net Flows (₹ cr) |
|---|---|---|---|---|---|
| Equity Index Funds (Domestic) | 1,44,18,895 | +14.88% | 1,92,733.13 | +17.46% | +6,414.77 |
| Equity Index Funds (International) | 2,97,183 | +21.58% | 6,709.02 | +32.89% | −36.25 |
| Debt Index Funds (TMIF) | 1,75,166 | +1.83% | 96,384.51 | +1.08% | +1,256.26 |
| Debt Index Funds (Ex-TMIF) | 33,714 | +57.85% | 7,790.14 | −49.21% | +537.96 |
| Other Index Funds | 1,06,033 | +8.67% | 3,698.66 | +3.65% | −3.98 |
| Gold ETF | 1,23,97,731 | +77.88% | 1,71,468.35 | +191.18% | +2,265.68 |
| Equity Oriented ETFs (Domestic) | 1,85,91,188 | +15.72% | 7,01,794.20 | +7.24% | +23,820.37 |
| Equity Oriented ETFs (International) | 11,84,047 | +39.54% | 16,656.74 | +33.43% | −50.19 |
| Debt Oriented ETFs | 26,14,340 | +7.57% | 96,387.49 | −1.04% | −3,283.85 |
| Silver ETF | 55,54,644 | +710.85% | 79,805.84 | +420.27% | −683.91 |
| FOFs Overseas (Active Funds) | 12,10,209 | +57.00% | 29,694.16 | +71.47% | +571.94 |
| FOFs Overseas (Passive Funds) | 5,33,419 | −13.30% | 8,592.41 | +11.40% | −41.21 |
| Total Passive Funds | 5,71,16,569 | +37.72% | 14,11,714.66 | +23.08% | +30,767.60 |
Folios measure the number of investor accounts in a category, making them a direct gauge of how many people chose to invest, not just how much was deployed. In a year of equity market volatility and a sharp commodity rally, folio data shows where retail conviction ran deepest.
Gold delivered approximately 60% returns in rupee terms during FY26 (MCX gold: ~₹90,000/10g in April 2025 to ~₹1,52,000/10g by end-March 2026). Silver surged even more dramatically, more than doubling over the same period before hitting an all-time high of ₹4,10,000 per kg on MCX in the week of January 27, 2026, then correcting sharply. Despite silver ETF outflows of ₹826 crore in February 2026 and ₹684 crore in March 2026, folio counts held near record levels through both months, confirming that the majority of account holders stayed invested through the price correction rather than exiting. For more on how gold instruments are taxed in India, see the article on taxation of gold in India.
FOFs investing in Overseas Active Funds grew folios by 57% year-on-year to 12.10 lakh. Global equity markets faced significant volatility through much of FY26, yet Indian investors continued opening new positions in these funds. This points to a segment of retail investors consciously building exposure to international markets through the mutual fund route. It stands in contrast to FOFs investing in Overseas Passive Funds, the only passive category to record folio contraction at −13.3%, suggesting a preference for actively managed overseas strategies over passive global index replication.
Total passive AUM grew 23.08% year-on-year to ₹14,11,715 crore as of March 31, 2026. Three categories account for the majority of assets.
| Category | AUM (₹ crore) | YOY (%) | Share of Total Passive AUM |
|---|---|---|---|
| Equity Oriented ETFs (Domestic) | 7,01,794.20 | +7.24% | 49.7% |
| Equity Index Funds (Domestic) | 1,92,733.13 | +17.46% | 13.7% |
| Gold ETF | 1,71,468.35 | +191.18% | 12.1% |
| Debt Oriented ETFs | 96,387.49 | −1.04% | 6.8% |
| Debt Index Funds (TMIF) | 96,384.51 | +1.08% | 6.8% |
| Silver ETF | 79,805.84 | +420.27% | 5.7% |
| All Other Categories | 73,141.14 | -- | 5.2% |
| Total Passive AUM | 14,11,714.66 | +23.08% | 100% |
Equity-oriented domestic ETFs hold nearly half of all passive AUM at ₹7.02 lakh crore, underscoring their role as the primary vehicle for index-based investing in India. For an introduction to how index funds work, see the index fund glossary.
Gold ETFs grew AUM by 191% year-on-year to ₹1,71,468 crore, driven by the gold price rally through most of FY26. Silver ETFs grew AUM 420% year-on-year to ₹79,806 crore, a figure that reflects the sharp silver price surge through January 2026 even as prices corrected in the final two months of the financial year.
Equity index ETFs and equity index funds saw more measured AUM growth (7.24% and 17.46% respectively) relative to prior years, weighed down by the market correction in Q4 FY26. The Nifty 50 fell 9.37% in March alone on a close-to-close basis, compressing asset values even as equity index flows remained firmly positive. For context on the broader passive investing trend through FY25, see the article on passive fund flows in India 2025.
March 2026 was a standout month for passive flows. Total net inflows of ₹30,768 crore were more than double February's ₹13,879 crore, even as markets fell sharply and precious metals flows tapered significantly.
| Category | Mar-26 Net Flows (₹ cr) | Feb-26 Net Flows (₹ cr) | Change |
|---|---|---|---|
| Equity Oriented ETFs (Domestic) | +23,820.37 | +4,487.15 | +4.3x |
| Equity Index Funds (Domestic) | +6,414.77 | +3,233.44 | +1.98x |
| Gold ETF | +2,265.68 | +5,254.95 | −57% |
| Debt Index Funds (TMIF) | +1,256.26 | -- | -- |
| FOFs Overseas (Active Funds) | +571.94 | +903.77 | −37% |
| Debt Index Funds (Ex-TMIF) | +537.96 | -- | -- |
| Silver ETF | −683.91 | −826.00 | 2nd consecutive month negative |
| Debt Oriented ETFs | −3,283.85 | -- | -- |
| Total Passive Funds | +30,767.60 | +13,879.31 | +2.2x |
Equity Index ETFs dominated March flows with ₹23,820 crore, a 4.3x jump from February's ₹4,487 crore. This acceleration into a falling market points to institutional deployment into passive equity instruments at lower valuations. For the complete equity and SIP flow picture in March 2026, see the mutual fund data breakdown for March 2026.
Gold ETF flows moderated to ₹2,266 crore, well below the January 2026 highs, as gold prices pulled back from their peak. Silver ETF flows were negative for the second consecutive month at −₹684 crore, as investors turned cautious following the extreme price volatility in silver.
Debt Oriented ETFs saw outflows of ₹3,284 crore amid concerns about potential rate pressure during the month. The RBI had maintained its neutral stance at 5.25%, but uncertainty around whether conditions might tighten weighed on debt instrument positioning through March.
Consistent folio and AUM growth in domestic equity index funds and ETFs across FY26 reflects a maturing investor preference: using passive instruments for large-cap market exposure at lower cost and with broader diversification than stock-picking allows. Equity index ETFs alone held ₹7.02 lakh crore by March 2026, making them the single largest passive sub-category by a significant margin. This shift aligns with global evidence on how passive strategies perform over long periods relative to active management, a topic covered in the active vs passive portfolio management explainer. For investors evaluating how to build around passive funds, see how to select and build a strategy around passive funds.
Gold and Silver ETFs recorded folio growth in FY26 (77.9% and 710.9% respectively) that is disproportionate to what pure price-chasing behaviour would produce. Investors opening Gold ETF folios continued to add positions through months of price consolidation. Silver ETF folios, despite two months of net outflows in February and March 2026, show that many account holders held through the price correction rather than exiting. This pattern suggests mutual fund investors are genuinely building precious metals exposure as an asset class, not simply reacting to near-term price moves. Past price performance of precious metals, including the FY26 rally, is not indicative of future returns.
Total passive fund AUM stood at ₹14,11,715 crore (₹14.11 lakh crore) as of March 31, 2026, representing 23.08% growth year-on-year per AMFI data. Equity-oriented domestic ETFs account for nearly half that figure at ₹7.02 lakh crore.
Silver ETFs recorded the highest folio growth at 710.85% and AUM growth at 420.27% year-on-year, though both figures reflect a relatively low base from March 2025 combined with the sharp silver price rally through most of FY26. Among equity categories, International Equity ETFs grew folios 39.54% and AUM 33.43%.
Silver prices fell sharply from their January 2026 highs. MCX silver hit an all-time high of ₹4,10,000 per kg in the week of January 27, 2026 before correcting significantly. This triggered profit-booking and caution among ETF investors, resulting in two consecutive months of outflows: ₹826 crore in February and ₹684 crore in March (AMFI data). The year-on-year AUM figure still reflects strong growth due to the price appreciation that occurred through most of FY26.
Net inflows into domestic equity ETFs surged from ₹4,487 crore in February to ₹23,820 crore in March. This coincided with a sharp equity market correction with the Nifty 50 falling 9.37% during the month, and institutional investors appear to have deployed capital into passive equity instruments at lower valuations. Equity index funds also saw inflows nearly double month-on-month to ₹6,415 crore.
Two factors stand out in the FY26 data: increasing use of equity index funds and ETFs as a cost-efficient large-cap exposure vehicle, and growing retail adoption of gold and silver ETFs as portfolio diversification tools. The folio growth patterns in both segments appear to be structural rather than short-term. Please consult a SEBI-registered investment adviser to understand which passive instruments may be appropriate for your specific financial goals and risk profile.
Yes. FOFs investing in Overseas Passive Funds was the only passive category to record folio contraction in FY26, declining 13.3% year-on-year to 5.33 lakh folios as of March 2026. Its AUM still grew 11.4%, indicating existing investors stayed invested even as new account openings slowed.
Disclaimer: This article is for general information and educational purposes only. It does not constitute investment advice, a recommendation, or an offer to buy or sell any securities or financial instruments. All data is sourced from the AMFI Monthly Report March 2026 and AMFI Monthly Report February 2026, and is based on publicly available information subject to revision. Year-on-year comparisons are March 2026 versus March 2025. Past market behaviour, fund performance, precious metals price trends, and flow patterns are not indicative of future outcomes. Investors should not make any investment decision based solely on this article. Please consult a SEBI-registered investment adviser or qualified financial professional before making any investment decision. Mutual fund investments are subject to market risks. Please read all scheme-related documents carefully before investing.
No spam. Only new posts, simple explainers, and practical money checklists for busy professionals.
Finnovate is a SEBI-registered financial planning firm that helps professionals bring structure and purpose to their money. Over 3,500+ families have trusted our disciplined process to plan their goals - safely, surely, and swiftly.
Our team constantly tracks market trends, policy changes, and investment opportunities like the ones featured in this Weekly Capsule - to help you make informed, confident financial decisions.
Learn more about our approach and how we work with you:
No comments yet. Start the conversation. What would you add?
No spam. Only new posts, simple explainers, and practical money checklists.
You may also like
Active equity fund AUM rose 3.3% to ₹37.34 lakh crore in June 2026. Price accretion of �...
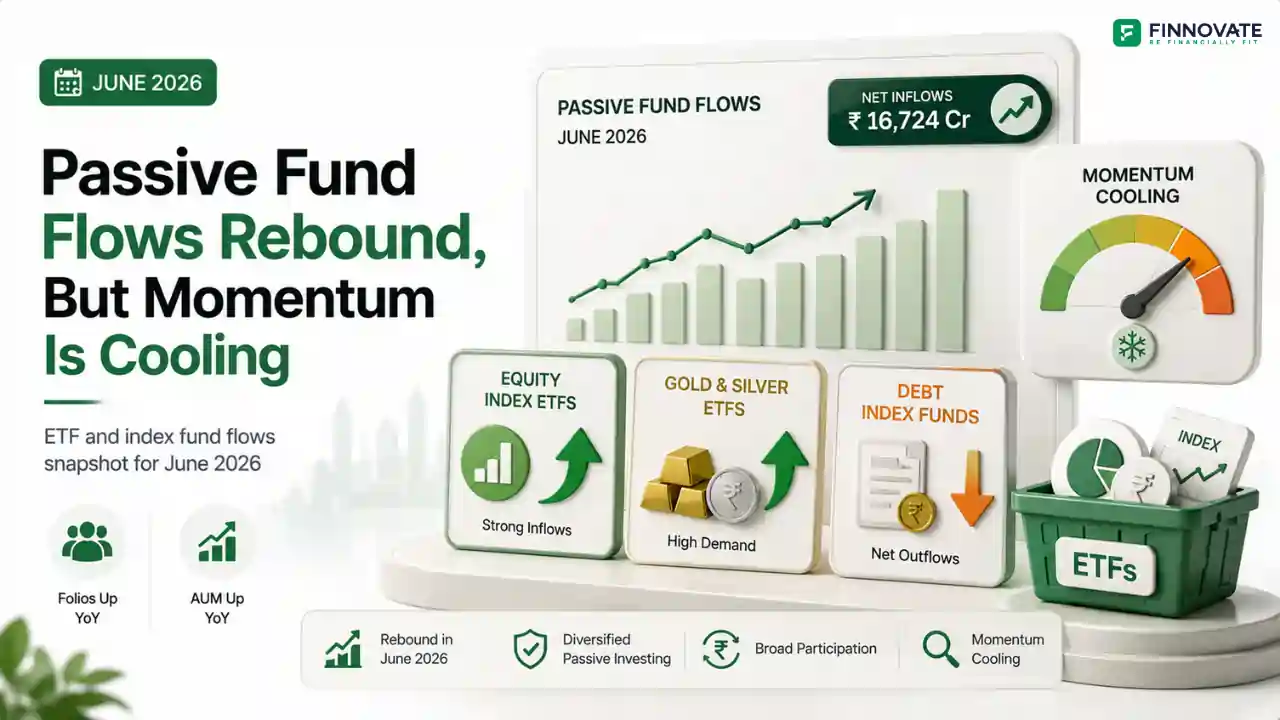
Passive fund inflows rebounded to ₹16,724 crore in June 2026, with gold and silver ETFs ...

Equity fund folios grew 22.96% CAGR and AUM 29.69% over 3 years. See which of the 11 categ...

Active equity MF inflows fell 40.4% in May 2026 to ₹22,908 crore, but still drove more A...
Popular now

Learn how to easily download your NSDL CAS Statement in PDF format with our step-by-step g...

Learn what SIF investment means in India, SEBI rules, Rs 10 lakh minimum investment, avail...

Looking for the best financial freedom books? Here’s a handpicked 2026 reading list with...

Clear guide to mutual fund taxation in India for FY 2025–26 after July 2024 changes: equ...