

Which Equity Fund Categories Grew the Fastest Over 3 Years?
Equity fund folios grew 22.96% CAGR and AUM 29.69% over 3 years. See which of the 11 categ...
08 July 2026
Last reviewed: May 2026
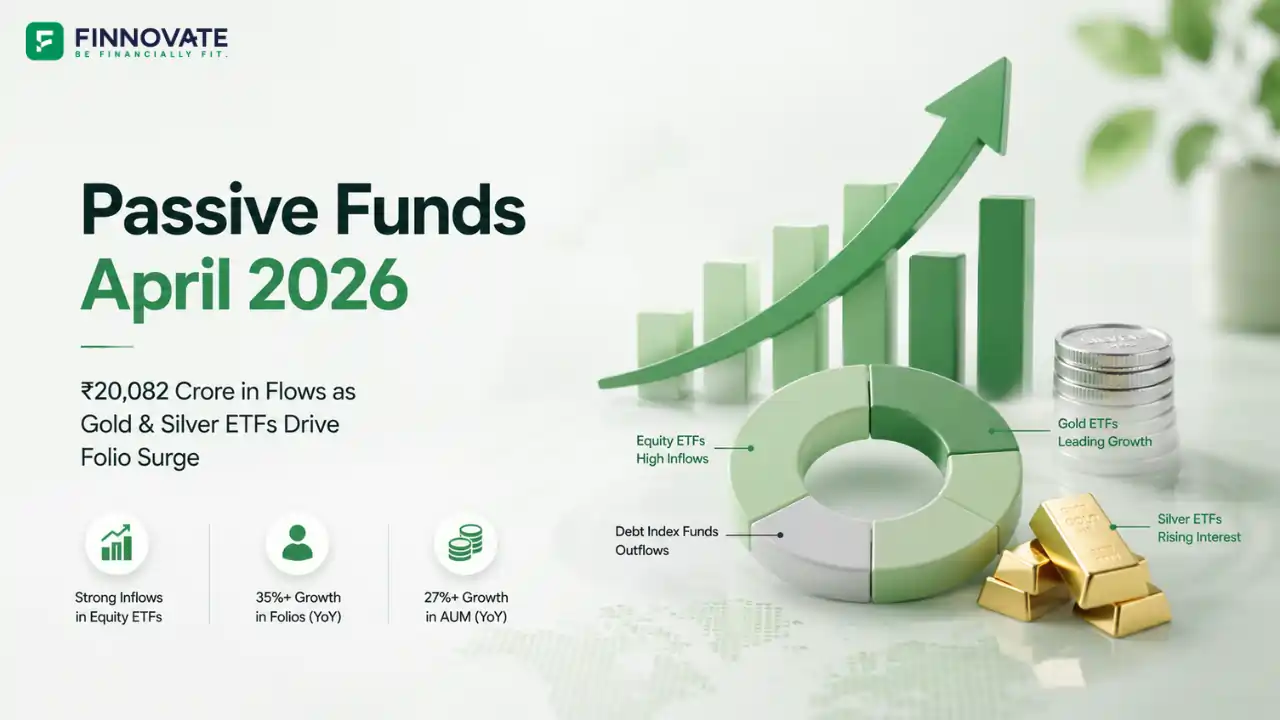
Passive fund flows in April 2026 came in at ₹20,082 crore, robust in absolute terms but 33% lower than March. The monthly contraction has a specific explanation: large outflows from debt index funds pulled the headline figure down. Equity-oriented passive flows were actually healthy, with Equity Index Funds and Equity Index ETFs together contributing nearly ₹20,000 crore of inflows between them.
The YoY picture tells a different story. Passive fund folios grew 35.07% and passive AUM grew 27.52% on a year-on-year basis as of April end. These are sustained, structural numbers that reflect the deepening of India's passive investing base, not a single-month event.
This article examines what drove the monthly flow contraction, what the folio and AUM data reveals about retail investor behaviour, and the two structural trends emerging in passive funds that are worth tracking.
| Passive Fund Scheme | Apr-26 Folios | YoY (%) | Apr-26 AUM (₹ Cr) | YoY (%) | Net Flows (₹ Cr) |
|---|---|---|---|---|---|
| Equity Index Funds (Domestic) | 1,46,28,856 | +16.01% | 2,23,091.55 | +28.93% | 10,218.31 |
| Equity Index Funds (International) | 2,94,083 | +22.13% | 7,619.14 | +54.83% | 3.42 |
| Debt Index Funds (TMIF) | 1,68,415 | -8.20% | 89,059.07 | -14.62% | (5,198.68) |
| Debt Index Funds (Ex-TMIF) | 34,910 | +283.37% | 7,415.47 | +17.73% | (432.44) |
| Other Index Funds | 1,16,058 | +17.82% | 3,871.94 | +6.38% | 35.22 |
| Gold ETF | 1,24,75,144 | +74.60% | 1,78,110.32 | +189.98% | 3,040.31 |
| Equity oriented ETFs (Domestic) | 1,87,71,617 | +16.16% | 7,66,182.13 | +11.50% | 9,667.54 |
| Equity oriented ETFs (International) | 11,89,213 | +29.45% | 19,275.37 | +51.77% | 0.00 |
| Debt Oriented ETFs | 16,61,969 | -30.83% | 97,527.29 | -0.24% | 1,214.02 |
| Silver ETF | 54,57,975 | +630.04% | 81,944.20 | +429.47% | (126.72) |
| FOFs on overseas Active Funds | 12,62,082 | +62.97% | 35,541.12 | +105.03% | 1,691.74 |
| FOFs on overseas Passive Funds | 5,30,067 | -12.78% | 9,904.03 | +32.02% | (30.76) |
| Total Passive Funds | 5,65,90,389 | +35.07% | 15,19,541.62 | +27.52% | 20,081.99 |
April's ₹20,082 crore was 33% below March, but the contraction was concentrated rather than broad-based. One category accounts for most of the difference: Debt Index Funds (TMIF) saw outflows of ₹5,199 crore in April. Markets are pricing in the possibility of rate hikes by the RBI to counter rising inflation, and TMIF investors moved ahead of that risk.
The equity side of passive flows held up well. Equity Index Funds drew ₹10,218 crore and domestic equity ETFs added ₹9,668 crore. Together these two categories contributed nearly ₹20,000 crore of gross inflows. The monthly contraction was entirely a debt phenomenon.
Gold ETF flows at ₹3,040 crore were subdued relative to earlier months. Gold prices peaked in January 2026 and have softened since, and flows have followed the price. Silver ETF flows were negative for the third consecutive month at ₹127 crore of outflows, though the size remains small. The silver enthusiasm that had characterised late 2024 and early 2025 appears to have fully dissipated.
Folio count is a better measure of retail investor participation than AUM, because AUM is affected by market price movements while folios reflect actual investor decisions to open or maintain accounts. The YoY folio data for April 2026 shows distinct patterns across categories.
The three biggest folio growth drivers on a YoY basis were Silver ETFs at 630%, Non-TMIF Debt Index Funds at 283%, and Gold ETFs at 75%. The Silver ETF number reflects the lag effect of the surge in new account openings during the silver rally period. Most of those folios remain open even though recent flows have been negative, representing investors who participated in the silver trend and are now in a holding pattern.
TMIF Debt Funds and Debt Oriented ETFs saw folio contraction on a YoY basis. The TMIF contraction reflects the rate sensitivity concern already visible in the flow data. The overseas passive FOFs contraction is a function of regulatory restrictions on international fund investments that have capped this category's growth.
The broader equity passive categories, both domestic index funds and domestic equity ETFs, continued to show steady folio growth at approximately 16% YoY each. This is the structural core of the passive investing story in India: a consistently growing base of retail investors adding to domestic equity index products.
AUM growth on a YoY basis is dominated by gold and silver ETFs. Silver ETFs grew AUM by 429% and Gold ETFs by 190% on a YoY basis. These numbers are large because the April 2025 comparison base was low and because the gold and silver price rally through to January 2026 significantly inflated the market value of existing holdings.
The combined AUM of gold and silver ETFs now exceeds ₹2.60 trillion, a near-fourfold increase in one year. This reflects a structural shift in how Indian retail investors approach precious metals: not as physical jewellery or purely as a geopolitical hedge, but as a genuine portfolio diversifier accessible through a demat account with the same ease as an equity ETF.
Domestic equity index ETFs and equity index funds saw comparatively subdued AUM growth of 11.5% and 28.9% respectively on a YoY basis. This is partly a market performance effect: Indian indices have seen more muted returns over the past year compared to global benchmarks. The Equity Index Funds (International) category grew AUM 54.83% YoY and international equity ETFs grew 51.77% YoY, both driven by global markets outperforming India over the same period.
Debt index fund AUM contracted on a YoY basis. TMIF Debt Index Fund AUM fell 14.62% YoY, reflecting both the outflows and the price-level impact of rate expectations on duration instruments.
The YoY data shows sustained investor interest in international equity index funds and ETFs. AUM and folio growth in these categories consistently outpaces domestic equivalents. International equity index funds grew AUM 54.83% and international equity ETFs grew 51.77% YoY. FOFs on overseas active funds more than doubled AUM at 105% YoY growth.
However, the regulatory framework around overseas mutual fund investments continues to limit how much fresh money can flow into this category. SEBI and AMFI maintain industry-wide investment caps that mean international passive fund schemes cannot accept fresh subscriptions beyond the industry limit. Investor interest in global diversification through passive funds is real but structurally constrained for now.
Gold ETF folios stand at 1.24 crore and Silver ETF folios at 54.57 lakh. What has changed is not just the number of investors but the nature of the holding. These are demat-held, exchange-traded instruments rather than physical metal. The transition from physical gold to exchange-traded gold instruments represents a genuine evolution in how Indian households approach their gold allocation.
Gold ETFs and the newly available EGRs on NSE are now portfolio options with the same operational ease as any equity ETF. The April 2026 data confirms that this is a durable structural shift, not a momentum trade. Even with gold prices off their January 2026 highs, gold ETF folios continued to grow at 74.6% YoY and inflows at ₹3,040 crore remained positive.
Passive funds have grown from a niche to a ₹15 lakh crore category. Whether your allocation to index funds, gold ETFs, or international passive products is calibrated to your goals is worth reviewing in a 30-minute call.
Book a free callApril's ₹20,082 crore was 33% below March primarily due to outflows from TMIF Debt Index Funds of ₹5,199 crore. Markets are pricing in potential RBI rate hikes to counter rising inflation, which pushed investors to reduce exposure to duration-sensitive debt products. Equity passive flows were healthy in April and were not the source of the contraction.
Equity Index Funds (Domestic) led with ₹10,218 crore, followed by domestic Equity ETFs at ₹9,668 crore. FOFs on overseas Active Funds contributed ₹1,692 crore. Debt Oriented ETFs also saw modest inflows of ₹1,214 crore despite the broader debt outflow trend in the month.
The 190% YoY AUM growth in Gold ETFs reflects the strong price rally that ran through to January 2026. Even though gold prices have softened since then, the AUM remains elevated because existing holdings were marked up significantly during the rally period. Folio growth of 74.60% YoY reflects genuine retail adoption of Gold ETFs as a portfolio instrument, which has continued even after the price correction.
Silver ETF flows turned negative following the softening of silver prices after their earlier rally. The folios opened during the silver enthusiasm phase remain active, explaining the 630% YoY folio growth, but fresh money is not flowing in at the same pace. This reflects a classic post-rally consolidation in retail investor behaviour rather than structural disinterest in the category.
Several fund houses offer international equity index funds and ETFs in India, but the category is subject to industry-wide investment limits set by SEBI and AMFI. As a result, many international passive fund schemes have periodically suspended fresh subscriptions when the industry limit is reached. Please consult a SEBI-registered investment adviser for guidance on international diversification options currently available to you.
Disclaimer: This article is for general information and educational purposes only. It does not constitute investment advice, a recommendation, or an offer to buy or sell any securities or financial instruments. Past market behaviour, AUM growth, and flow patterns are not indicative of future outcomes. No investment decision should be made based solely on the contents of this article. Please consult a SEBI-registered investment adviser or qualified financial professional before making any investment decision. Mutual fund investments are subject to market risks.
No spam. Only new posts, simple explainers, and practical money checklists for busy professionals.
Finnovate is a SEBI-registered financial planning firm that helps professionals bring structure and purpose to their money. Over 3,500+ families have trusted our disciplined process to plan their goals - safely, surely, and swiftly.
Our team constantly tracks market trends, policy changes, and investment opportunities like the ones featured in this Weekly Capsule - to help you make informed, confident financial decisions.
Learn more about our approach and how we work with you:


No spam. Only new posts, simple explainers, and practical money checklists.
You may also like
Equity fund folios grew 22.96% CAGR and AUM 29.69% over 3 years. See which of the 11 categ...

Active equity MF inflows fell 40.4% in May 2026 to ₹22,908 crore, but still drove more A...

Passive fund net inflows hit just ₹362 crore in May 2026 despite 33% folio and 25% AUM g...
Popular now
Learn how to easily download your NSDL CAS Statement in PDF format with our step-by-step g...
Learn what SIF investment means in India, SEBI rules, Rs 10 lakh minimum investment, avail...
Looking for the best financial freedom books? Here’s a handpicked 2026 reading list with...
Clear guide to mutual fund taxation in India for FY 2025–26 after July 2024 changes: equ...