

Mutual Fund AUM May 2026: Flows Beat Price Moves Across Equity Categories
Active equity MF inflows fell 40.4% in May 2026 to ₹22,908 crore, but still drove more A...
15 June 2026

Passive investing used to be a niche idea in India. A few institutional investors, a handful of ETFs, and limited retail awareness. That picture has changed significantly. As of February 2026, passive funds account for roughly 17% of total mutual fund AUM in India, managing over ₹15 lakh crore in assets across index funds, ETFs, gold funds, and fund of funds.
The shift is not accidental. A combination of cost pressure, growing data on active fund underperformance, and broader investor awareness has made passive products more relevant to a wider range of investors. This article explains what passive investing means, why it has gained momentum in India, how different passive products work, and what investors should keep in mind before using them.
Passive investing means tracking an index rather than trying to beat it. A passive fund, whether an index fund or an ETF, buys the same stocks as its benchmark index in the same proportions, and holds them as long as those stocks remain in the index.
The objective is not to outperform the market. It is to deliver returns that closely match the index, at the lowest possible cost. The primary measure of how well a passive fund does this job is called tracking error. The smaller the gap between the fund's returns and the index's returns, the better.
Because there is no active stock selection involved, passive funds carry significantly lower costs than actively managed funds. Some Nifty 50 ETFs in India now operate with expense ratios as low as 0.02% to 0.05% per year, compared to active large-cap funds that typically charge between 1% and 2%.
The scale of passive fund growth in India becomes clear when you look at the data over time. As recently as FY17, passive funds accounted for just 3% of total mutual fund AUM. That share grew rapidly to around 17% by FY23, driven primarily by institutional flows into ETFs and growing retail awareness of index funds.
The growth has been led by equity ETFs, which account for the majority of passive AUM, followed by index funds. Gold ETFs have also seen a surge in recent years, driven by strong precious metal prices. Within passive products, ETFs have grown faster than index funds, primarily because of their listing advantage and typically lower expense ratios.
| Passive Fund AUM Snapshot | Feb-23 AUM (₹ Cr) | Feb-26 AUM (₹ Cr) | 3-Year CAGR |
|---|---|---|---|
| Total Passive Funds | 6,63,883 | 15,23,697 | 31.91% |
| Gold ETFs | 21,400 | 1,83,325 | 104.61% |
| Index Funds (Equity) | 1,38,814 | 3,24,567 | 32.73% |
| Index ETFs (Equity) | 4,81,776 | 9,76,208 | 26.54% |
Two factors, more than any other, have driven the shift toward passive investing in India: cost and performance data.
The SPIVA India Scorecard, published by S&P Dow Jones Indices, tracks how actively managed Indian mutual funds perform against their benchmark indices over different time horizons. The findings across years have been consistent.
For large-cap funds, the picture is particularly stark. SPIVA data shows that around 65% to 85% of active large-cap funds in India underperform their benchmark over one-year, three-year, and five-year periods. The underperformance rate at the five-year horizon has at times crossed 90%.
Two structural reasons explain this. First, large-cap stocks are heavily researched - hundreds of analysts track the same companies, so pricing is relatively efficient and there is little undiscovered information for fund managers to exploit. Second, SEBI limits mutual funds to a maximum 10% exposure to any single stock, which restricts concentration in the few stocks that drive most index returns in a given period.
Active large-cap funds in India typically carry expense ratios between 1% and 2% per year for regular plans. Nifty 50 index funds and ETFs in direct plans now operate at 0.10% or below, with some ETFs charging as little as 0.02% to 0.05%.
That gap compounds significantly over long holding periods. A fund delivering 10% gross returns but charging 1.5% in fees leaves the investor with 8.5%. An index fund delivering the same 10% gross but charging 0.10% leaves 9.9%. Over ten or fifteen years, that difference in compounding creates a meaningful gap in final corpus value.
This cost arithmetic has become more visible to investors as financial literacy improves and direct plan data is more widely accessible.
The case for passive investing is strongest in the large-cap space. Outside it, the picture changes.
In mid-cap and small-cap segments, markets are less efficiently priced. Analyst coverage is thinner, and skilled fund managers have more opportunity to identify companies before they are widely tracked. SPIVA data shows that the percentage of active funds underperforming their benchmarks is lower in mid-cap and small-cap categories than in large-cap. That said, outperformance is not guaranteed and results vary significantly across years and funds.
This is why passive funds do not replace active funds across the board. For many investors, a combination of both - passive exposure to large-cap markets and selective active exposure in mid-cap or small-cap segments - may be more appropriate than a purely passive or purely active approach.
Passive investing in India is not limited to a single product type. Several structures are available, each with different mechanics and use cases.
These track domestic equity indices such as the Nifty 50, Sensex, Nifty Next 50, Nifty 100, Nifty Midcap 150, or Nifty 500. They can be bought and sold at end-of-day NAV, like any other mutual fund. They do not require a demat account and are well-suited for SIP investing through standard investment platforms.
ETFs track the same indices as index funds but trade on stock exchanges at real-time prices, like shares. They typically have lower expense ratios than index funds but require a demat account and brokerage account to purchase. Liquidity varies across ETFs, so bid-ask spreads matter for investors transacting in smaller amounts.
These track specific sectors such as banking, IT, or infrastructure, or thematic indices like defence or manufacturing. They carry higher concentration risk than broad-based index funds and are more susceptible to cyclical swings within a sector. Investors considering these should have a clear view on why that sector exposure fits their portfolio.
These track government securities or corporate bond indices, offering low-cost fixed income exposure. They are useful for investors who want debt exposure with transparency about portfolio composition, without relying on a fund manager's duration or credit calls.
These track domestic gold prices and offer a regulated, transparent way to hold gold within a portfolio. Gold ETFs require a demat account. They differ from gold mutual funds, which are fund of funds that invest in gold ETFs and do not require a demat account, in both cost and transaction mechanics.
For investors who want equity exposure with predictability and minimal fees, a broad-based Nifty 50 or Nifty 100 index fund can form the core of a portfolio. This is particularly relevant in the large-cap segment, where active funds have struggled to consistently outperform after costs.
Index funds allow investors to increase or reduce equity exposure efficiently, without taking a view on individual stocks or sectors. Shifting between an equity index fund and a debt index fund to maintain a target asset allocation is a clean and low-cost way to manage portfolio balance.
Timing entry into equity markets is difficult and often counterproductive. A monthly SIP in a broad-based index fund removes the timing decision, applies rupee cost averaging across market cycles, and keeps investment behaviour disciplined over the long term.
Two index funds tracking the same index can deliver different outcomes over time. The differences come from expense ratio and tracking error. A fund with a lower expense ratio and lower tracking error will, all else equal, deliver a better outcome for a long-term investor. Both metrics are disclosed by fund houses and available on AMFI's website.
Some products are marketed as enhanced index funds or smart beta strategies that claim to beat the index while remaining low cost. These involve active factor tilts and carry tracking risk relative to the index. They are not the same as a pure passive fund and should be evaluated on their own merits before use.
An index fund delivers the returns of the index, which also means it delivers the losses of the index. A Nifty 50 index fund will fall in line with the market during periods of correction. Passive investing reduces fund-manager risk and cost drag, but it does not eliminate market risk. Investors should have an appropriate holding horizon and asset allocation to manage this.
Passive funds work best as part of a broader, goal-linked portfolio. Many investors use passive funds for core large-cap exposure and active funds in mid-cap or small-cap segments where skilled managers may add more value. The right mix depends on an individual's goals, time horizon, and risk tolerance.
Both track a benchmark index, but they differ in how they are bought. Index funds are purchased at end-of-day NAV through investment platforms and do not require a demat account. ETFs trade on stock exchanges at real-time prices and require a demat and brokerage account. ETFs typically have lower expense ratios than equivalent index funds.
Large-cap stocks are heavily researched, making it difficult to consistently find mispriced opportunities. SEBI's 10% single-stock cap also restricts active funds from concentrating in the few top performers. After fees, most active large-cap funds deliver less than the index they track.
Not necessarily. Passive funds have a stronger case in large-cap equity, where active underperformance has been well documented. In mid-cap and small-cap segments, skilled active fund managers can still add value over full market cycles. Many investors benefit from a combination of both rather than choosing one exclusively.
Two metrics matter most: expense ratio and tracking error. A lower expense ratio means more of the index return reaches the investor. A lower tracking error means the fund is accurately replicating the index. Both are disclosed by fund houses and available on AMFI's website. For ETFs, fund size and liquidity also matter.
Yes. Index funds support SIP investment just like any other mutual fund, on a monthly or quarterly basis. A SIP in a broad-based index fund is a straightforward way to build equity exposure over time through rupee cost averaging, without the need to time the market.
Tracking error measures how closely a fund's returns match its benchmark index. A fund with low tracking error replicates the index accurately. A high tracking error means the fund's returns deviate from the index, which can reduce the core benefit of passive investing. It is disclosed in fund factsheets and should be checked alongside expense ratio.
Disclaimer: This article is for general information and educational purposes only. It does not constitute investment advice, a recommendation, or an offer to buy or sell any mutual fund or security. Past performance of any fund category, index, or investment strategy is not indicative of future returns. Passive investing and index fund investing carry market risks. Please read all scheme-related documents carefully before investing and consult a SEBI-registered investment adviser or qualified financial professional before making any investment decision. Mutual fund investments are subject to market risks.
No spam. Only new posts, simple explainers, and practical money checklists for busy professionals.
Finnovate is a SEBI-registered financial planning firm that helps professionals bring structure and purpose to their money. Over 3,500+ families have trusted our disciplined process to plan their goals - safely, surely, and swiftly.
Our team constantly tracks market trends, policy changes, and investment opportunities like the ones featured in this Weekly Capsule - to help you make informed, confident financial decisions.
Learn more about our approach and how we work with you:


No spam. Only new posts, simple explainers, and practical money checklists.
You may also like
Active equity MF inflows fell 40.4% in May 2026 to ₹22,908 crore, but still drove more A...

Passive fund net inflows hit just ₹362 crore in May 2026 despite 33% folio and 25% AUM g...
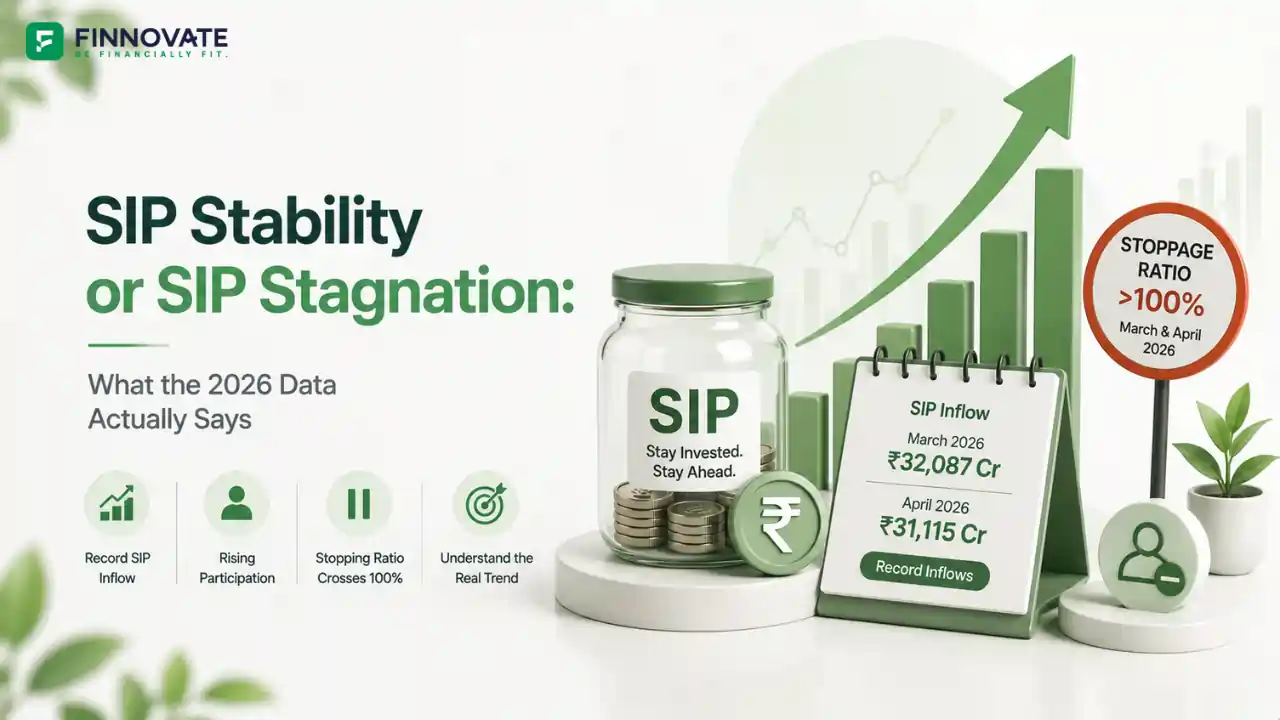
SIP inflows hit a record ₹32,087 crore in March 2026. Yet the stoppage ratio crossed 100...

India's household savings in equities and MFs rose from 2% to 15.2% between FY12 and FY25,...
Popular now
Learn how to easily download your NSDL CAS Statement in PDF format with our step-by-step g...
Learn what SIF investment means in India, SEBI rules, Rs 10 lakh minimum investment, avail...
Looking for the best financial freedom books? Here’s a handpicked 2026 reading list with...
Clear guide to mutual fund taxation in India for FY 2025–26 after July 2024 changes: equ...