
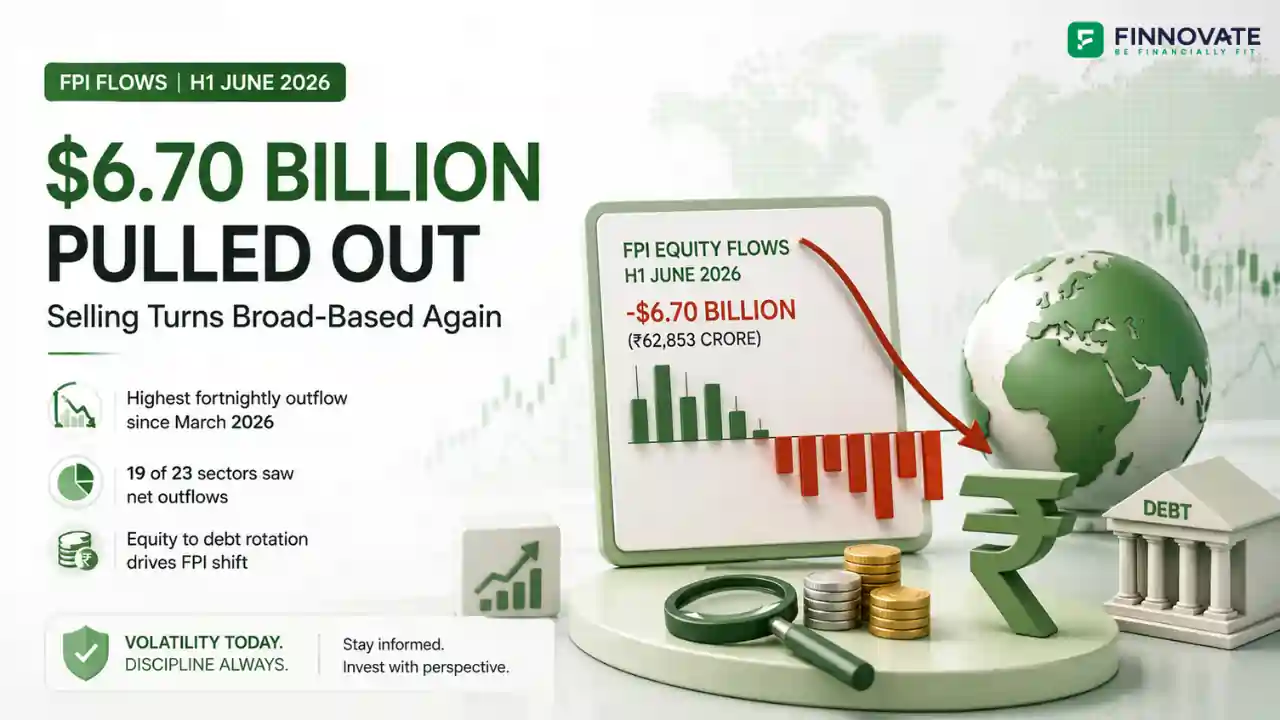
FPI Flows H1 June 2026: $6.7 Billion Sold, BFSI and Oil Lead Outflows
FPIs sold $6.70 billion from Indian equities in H1 June 2026, reversing May's tapering tre...
22 June 2026
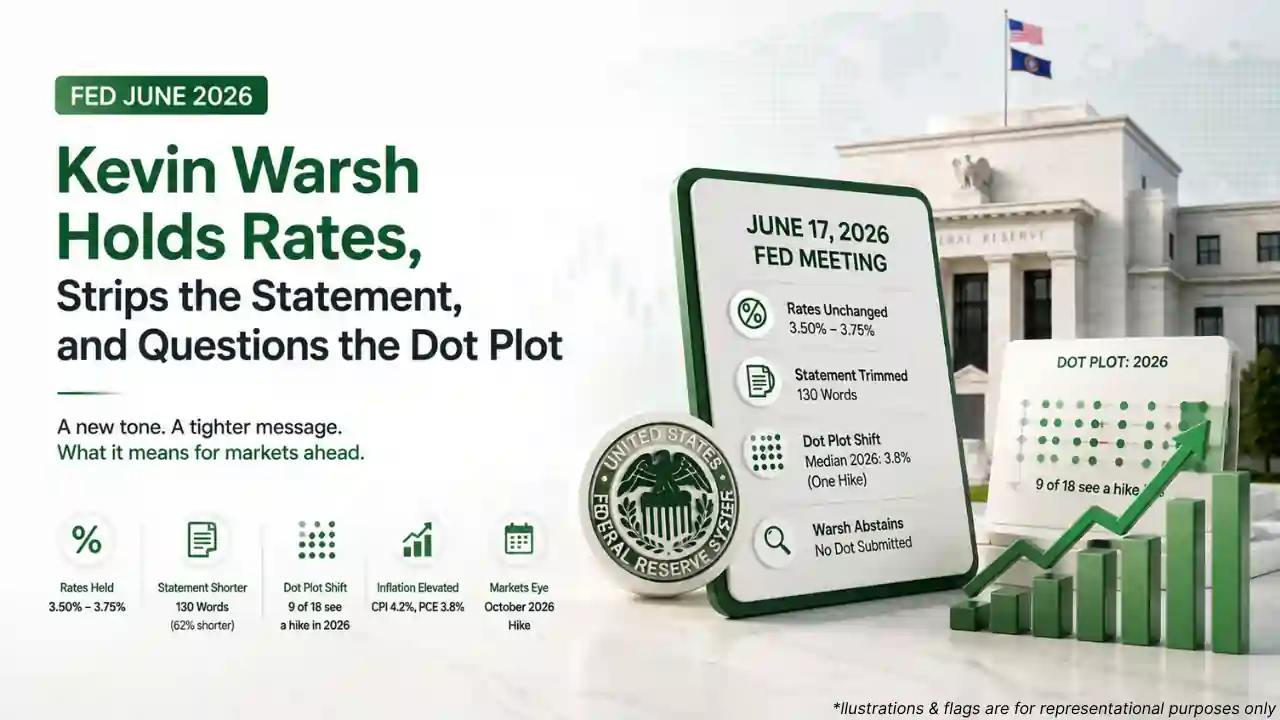
Meeting date: June 17, 2026 | Chair: Kevin Warsh (first meeting as Fed Chairman)
The Federal Reserve's June 17, 2026 meeting was less about what the Fed did and more about what it stopped doing. Rates were held unanimously at 3.50% to 3.75%. The policy statement was cut from 341 words to 130. The dot plot showed nine of eighteen officials now expect a rate hike in 2026. And Chairman Kevin Warsh submitted no dot of his own, abstaining from the projections he has openly questioned.
June 2026 Fed: Key numbers
| Parameter | April 2026 Meeting | June 2026 Meeting |
|---|---|---|
| Rate decision | Hold at 3.50% to 3.75% | Hold at 3.50% to 3.75% |
| Policy statement length | 341 words | 130 words (62% shorter) |
| Forward guidance language | Easing-leaning language retained (drew 3 dissents) | Removed entirely |
| Dot plot: rate cut in 2026 | One cut projected (base case) | No cut projected; one hike now base case |
| Median year-end 2026 dot | 3.4% | 3.8% (one 25bps hike from current ceiling) |
| Chairman's own dot | Powell submitted projection | Warsh abstained: no dot submitted |
| Market reaction | Stocks rose on easing hopes | Stocks fell; S&P 500 -0.6%; 2-year yield +11bps |
The dot plot is the Fed's quarterly grid showing where each official expects rates to be over the coming years. Warsh submitted no dot. During the press conference he said he encouraged colleagues to do so, but not himself.
Warsh's position, stated before his chairmanship and demonstrated by action in June, is that macro projections made by the Fed are too easily influenced by market pricing rather than the other way around. CME FedWatch, which prices rate probabilities through futures markets, has repeatedly shaped what officials project in the dot plot, creating a feedback loop where market expectations inform official forecasts, which then move markets again. Warsh's preference is for the Fed to respond to incoming data rather than anchor itself to projections that are updated quarterly and consistently require revision.
The brief for changing the communication model is not philosophical; it is empirical. Fed projections over the past three years have required repeated material revision in response to events the models did not anticipate.
| What the Fed projected | What happened |
|---|---|
| Inflation returning to 2% by 2026 | CPI at 4.2% in May 2026; PCE at 3.8% in April 2026 |
| Rate cuts as the primary direction through 2026 | Dot plot now shows one hike as base case; cuts pushed to 2027-28 |
| Significant unemployment spike from tariffs and Iran conflict | Unemployment at 4.3%, unchanged over a year |
| Sharp GDP contraction from tariff shock | Economic activity expanding at a "solid pace" per June statement |
The reversals are not a failure of economists. They reflect the nature of forecasting through supply-shock events: the pandemic, supply chain disruptions, the Russia-Ukraine war, and the Iran conflict each forced rapid recalibration. The argument is not that projections are useless; it is that publishing them quarterly creates an expectation of accuracy that the underlying uncertainty does not support.
The policy direction under Warsh is a move from forward guidance (here is what we plan to do) to data-response (here is what we are seeing, and here is how we will react). A shorter statement, no personal dot, and no committed press conference schedule after every meeting all point in the same direction. For markets, this means less predictability from the Fed itself and more weight placed on incoming economic data as the signal for what the Fed will do next. The October meeting, where FedWatch currently prices a 60.7% probability of a hike, is the first live test of whether the data justifies the move the dot plot implies.
A rate hike environment changes the calculus on fixed income, equity valuations, and currency exposure. The FinnFit Financial Fitness Test takes 3 minutes and shows whether your portfolio is positioned for the current rate environment.
Take the FinnFit TestNo. The Federal Reserve held rates at 3.50% to 3.75% at the June 17, 2026 meeting. The dot plot, however, shifted to show one 25bps hike as the base case for 2026, with the median projection moving from 3.4% to 3.8% for year-end 2026. Markets are currently pricing a 60.7% probability of a hike at the October meeting.
The dot plot is the Fed's quarterly grid showing each official's anonymous projection for where rates will be in future years. Warsh abstained from submitting his own projection, stating at the June 17 press conference that he encouraged colleagues to submit theirs but chose not to himself. His position is that the quarterly projection framework creates a misleading expectation of precision and that market-based rate pricing (CME FedWatch) has been influencing official dots rather than the reverse.
Warsh has criticised the Fed for overcommunicating. The June statement was 130 words, approximately two-thirds shorter than April's 341-word statement. All forward guidance language was removed. The shortened statement is consistent with Warsh's stated preference for a data-response model: the Fed observes and reacts to incoming data rather than signalling a predetermined path.
Warsh's stated preference is for the Fed to be analytical and data-responsive rather than guidance-driven. He has argued that supply-shock inflation should generally be "looked through" when formulating policy, and that artificial intelligence will have a disinflationary impact over time through productivity gains. He has also committed to strict Fed independence and a 2% inflation target, stating the "two is to the left of the decimal point" and that the target will not be reconsidered until it is first met.
Disclaimer: This article is for general information and educational purposes only. It does not constitute investment advice, a recommendation, or an offer to buy or sell any securities or financial instruments. All Federal Reserve policy data referenced is from the FOMC statement and press conference of June 17, 2026. CME FedWatch probabilities referenced are indicative market pricing and subject to change. Past Fed projections referenced are from publicly available FOMC Summary of Economic Projections. Please consult a SEBI-registered investment adviser before making any investment decision.
No spam. Only new posts, simple explainers, and practical money checklists for busy professionals.
Finnovate is a SEBI-registered financial planning firm that helps professionals bring structure and purpose to their money. Over 3,500+ families have trusted our disciplined process to plan their goals - safely, surely, and swiftly.
Our team constantly tracks market trends, policy changes, and investment opportunities like the ones featured in this Weekly Capsule - to help you make informed, confident financial decisions.
Learn more about our approach and how we work with you:


No spam. Only new posts, simple explainers, and practical money checklists.
You may also like
FPIs sold $6.70 billion from Indian equities in H1 June 2026, reversing May's tapering tre...

Indian online shoppers lose ₹25,000-28,000 crore a year to dark patterns. 88% are affect...
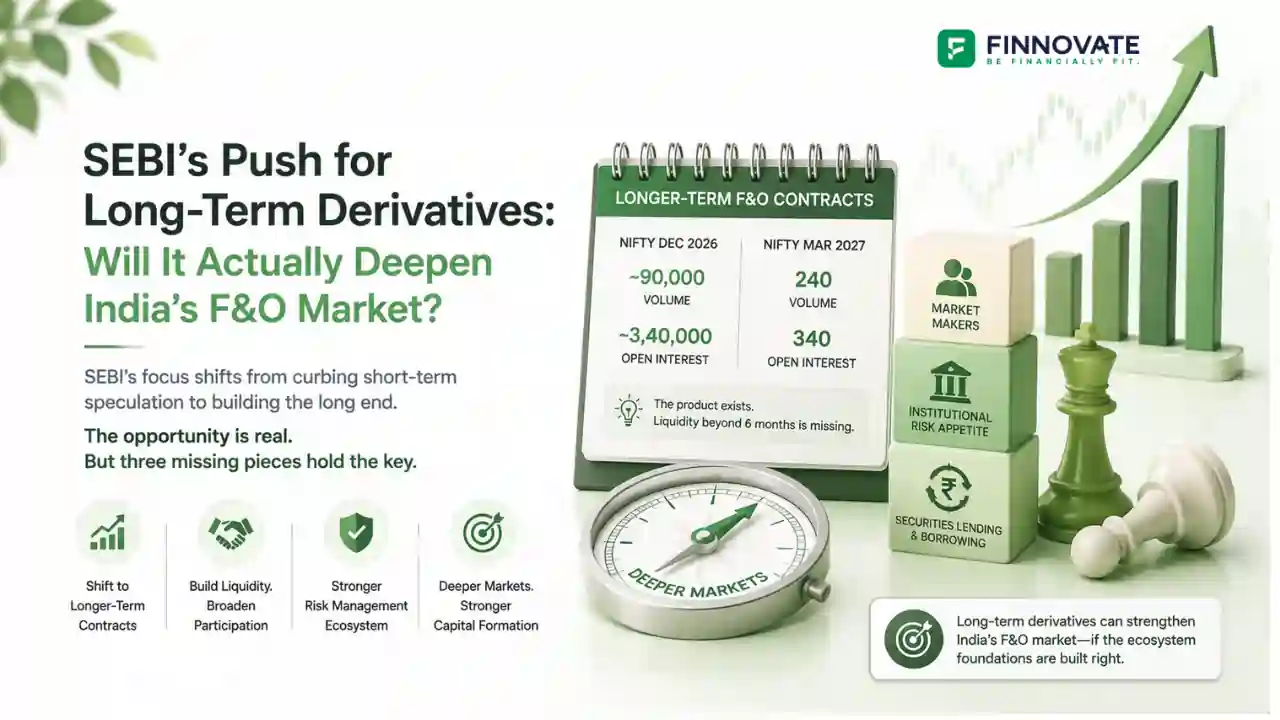
SEBI Chairman announced longer-term F&O contracts on June 12, 2026. But quarterly Nifty op...
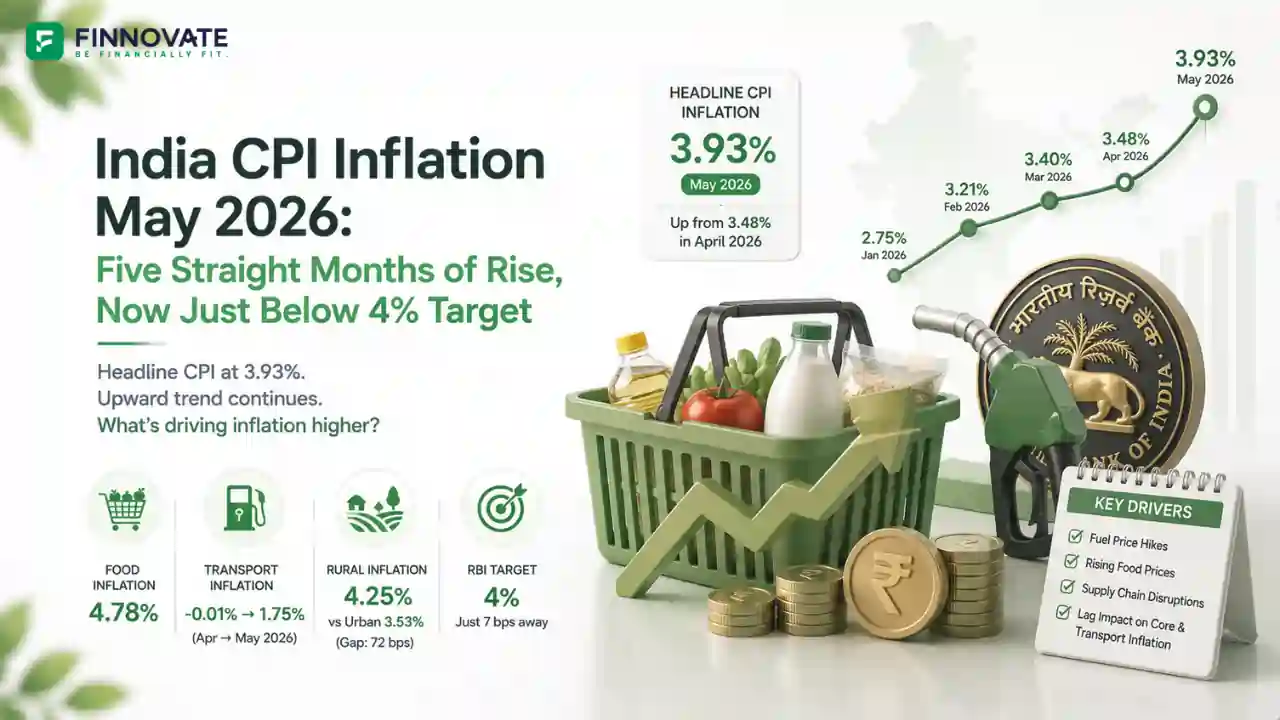
India's headline CPI rose to 3.93% in May 2026, food inflation hit 4.78%, and transport in...
Popular now
Learn how to easily download your NSDL CAS Statement in PDF format with our step-by-step g...
Learn what SIF investment means in India, SEBI rules, Rs 10 lakh minimum investment, avail...
Looking for the best financial freedom books? Here’s a handpicked 2026 reading list with...
Clear guide to mutual fund taxation in India for FY 2025–26 after July 2024 changes: equ...