

Why India Is Buying More Oil on the Spot Market After the 2026 Middle East Crisis
India's crude imports shifted fast after the 2026 Iran war. Russia's share hit 52-54% by J...
09 July 2026

Foreign portfolio investor selling returned sharply to Indian equities in the first half of March 2026. The overall outflow was about $5.7 billion, and the biggest pressure point was not broad-based alone. Financial stocks took the heaviest hit, with BFSI accounting for about 60% of the total equity selling. That made financials the clear centre of the March sell-off story.
The timing of the move matters. This selling came after a stronger February, when foreign investors had briefly turned net buyers again. But the mood changed quickly in March as global risk appetite weakened. Rising crude oil prices, rupee pressure, and fresh geopolitical stress brought India’s macro vulnerability back into focus, especially because India remains sensitive to imported energy costs.
At the same time, the pattern of selling tells us this was not just random risk reduction. FPIs cut exposure most heavily in BFSI, which remains one of the largest, most liquid, and most institutionally owned parts of the Indian market. When overseas investors need to reduce India exposure quickly, financials often become the first place where that adjustment shows up.
Short Summary
FPIs sold around $5.7 billion of Indian equities in the first half of March 2026, and BFSI alone accounted for roughly 60% of that selling. The mix of higher crude prices, rupee weakness, geopolitical stress, and shifting EM allocations made financials the biggest target in the latest foreign sell-off.
The sector table shows a very clear split between a few areas of buying and a much wider set of selling. On the positive side, capital goods saw the strongest buying at $422 million, followed by metals and mining at $95 million, power at $65 million, and a few small positive readings in consumer services, chemicals, and others.
The much bigger story, though, was on the sell side. Financial services recorded -$3,443 million, which was by far the largest sector outflow. That was followed by automobiles and components at -$520 million, telecom at -$417 million, construction at -$322 million, oil, gas and consumable fuels at -$317 million, healthcare at -$264 million, FMCG at -$260 million, and realty at -$231 million.
| Sectoral Classification (NSDL Template) |
Equity Flows ($ Million) |
Sectoral Classification (NSDL Template) |
Equity Flows ($ Million) |
|---|---|---|---|
| Capital Goods | 422 | Services | -138 |
| Metals & Mining | 95 | Construction Materials | -161 |
| Power | 65 | Consumer Durables | -187 |
| Others | 59 | Realty | -231 |
| Consumer Services | 57 | Fast Moving Consumer Goods | -260 |
| Chemicals | 24 | Healthcare | -264 |
| Diversified Industries | 0 | Oil, Gas & Consumable Fuels | -317 |
| Forest Materials | 0 | Construction | -322 |
| Utilities | -2 | Telecommunication | -417 |
| Media, Entertainment | -6 | Automobile and Components | -520 |
| Textiles | -19 | Financial Services (BFSI) | -3,443 |
| Information Technology (IT) | -137 | Grand Total | -5,702 |
The key point is simple: the selling was broad, but it was clearly led by BFSI.
There are three reasons financials likely took the worst hit.
First, BFSI is one of the biggest and most liquid sectors in Indian equities. When foreign investors want to reduce risk quickly, they usually do it in names where they already have meaningful exposure and where execution is easier. Financials fit that profile.
Second, rising oil prices and rupee weakness usually push investors to re-examine India’s macro position. Higher crude can worsen inflation pressure, raise import stress, and complicate the growth-inflation balance. In that kind of setup, financials often become vulnerable because they sit at the centre of the domestic economic cycle.
Third, EM portfolio rebalancing may also have played a role. India’s relative position within the MSCI EM universe had cooled from earlier peaks, while Taiwan and Korea continued to benefit from semiconductor-linked investor interest. That makes financials an easy place for large funds to reduce overweight India exposure.
The immediate trigger was geopolitical stress. The March reversal came as the Middle East conflict lifted crude prices and worsened global risk sentiment. That created a direct problem for India because higher oil prices and a weaker rupee tend to raise concerns around inflation, margins, and domestic demand.
This helps explain why the sell-off spread across more than just financials. Autos, oil-linked names, FMCG, realty, and consumer durables also saw pressure. The sector pattern suggests that FPIs were not only reducing market exposure, but also trimming parts of the market seen as sensitive to input costs, consumption stress, and cyclical uncertainty.
At the same time, it is important not to overstate every interpretation. Some sector narratives are reasonable, but they are still interpretation. The hardest data point in this story remains the flow pattern itself.
The biggest positive surprise in the table was capital goods, which stood out sharply against the broader weak tone. Metals and power also remained in positive territory, though at much smaller levels.
On the losing side, the pressure was much broader. After financials, the notable laggards were autos, telecom, construction, oil and gas, healthcare, FMCG, and realty. This gives investors a more useful view of the market than just saying “FPIs sold India.”
The more precise takeaway is this: FPIs sold India with a very strong tilt against financials and several macro-sensitive sectors.
For long-term Indian investors, this kind of data should be read as a positioning signal, not as a buy or sell instruction.
The first takeaway is that foreign flows can still move sentiment sharply, especially when a liquid heavyweight sector like BFSI is involved. The second takeaway is that global triggers such as oil, the US dollar, geopolitical conflict, and EM allocation shifts can quickly overpower company-level narratives in the short run. The third takeaway is that sectors with strong long-term domestic stories can still see foreign selling if the global backdrop turns risk-off.
That is why this data matters. It is not just about how much FPIs sold. It is about where they sold, and what that says about the market’s current stress points.
1. FPI Selling in Early March 2026: Why Foreign Investors Pulled Out $6.55 Billion from India
2. Passive Fund Flows February 2026: Slower Inflows, Stronger Yearly Growth
3. Indian Companies Gaining From the Iran War, But Oil and Macro Risks Remain
4. India Energy Security Stockpiles: Why Gas Looks More Fragile Than Oil
BFSI is a large, liquid, and institutionally owned sector. When foreign investors reduce India exposure quickly, financials often become the first place where that selling shows up.
The broad number was around $5.7 billion of equity outflows in the first half of March 2026.
No. Financials took the largest hit, but autos, telecom, oil and gas, FMCG, realty, healthcare, and construction also saw net outflows.
Because higher crude prices can worsen inflation pressure, weaken the rupee further, and increase concern about India’s macro balance. That makes investors more cautious on India-sensitive sectors.
Not automatically. This kind of flow data is more useful as a market signal and context check than as a direct action trigger.
Disclaimer: This article is for educational and informational purposes only and should not be treated as investment advice, market timing advice, or a recommendation to buy or sell any security or sector. Readers should evaluate market data in context and seek independent professional advice where required.
No spam. Only new posts, simple explainers, and practical money checklists for busy professionals.
Finnovate is a SEBI-registered financial planning firm that helps professionals bring structure and purpose to their money. Over 3,500+ families have trusted our disciplined process to plan their goals - safely, surely, and swiftly.
Our team constantly tracks market trends, policy changes, and investment opportunities like the ones featured in this Weekly Capsule - to help you make informed, confident financial decisions.
Learn more about our approach and how we work with you:


No spam. Only new posts, simple explainers, and practical money checklists.
You may also like
India's crude imports shifted fast after the 2026 Iran war. Russia's share hit 52-54% by J...
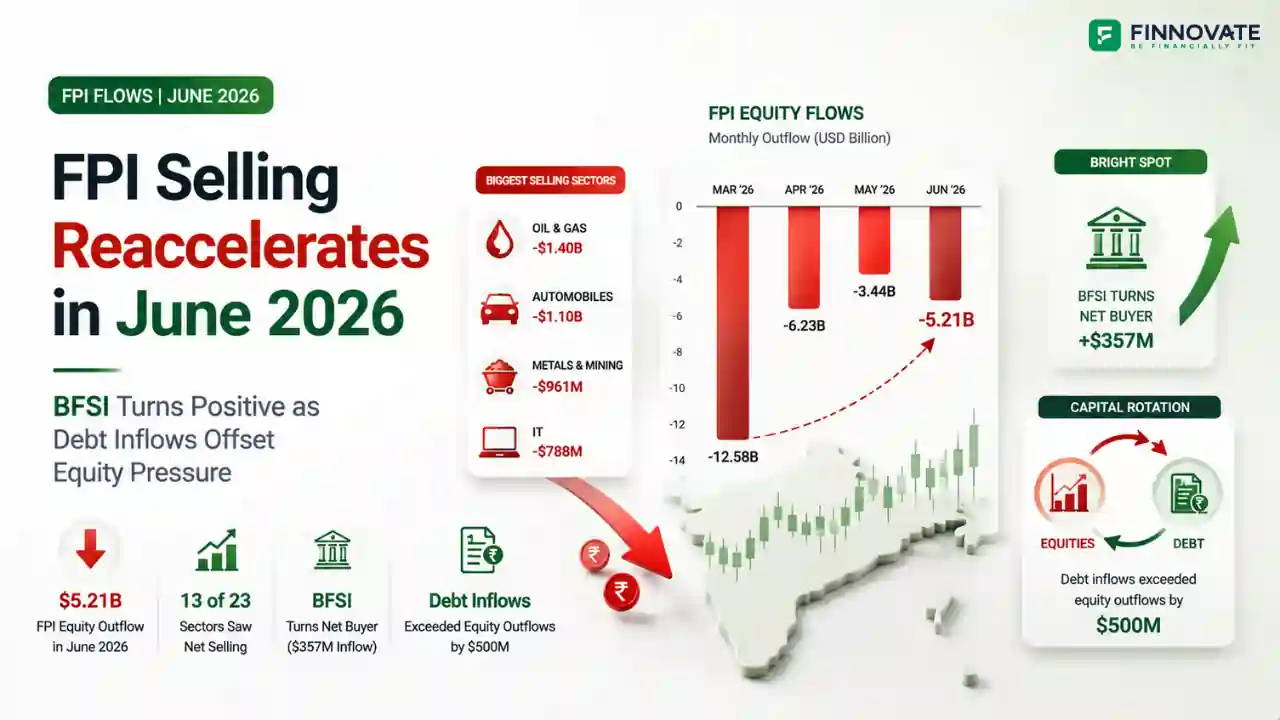
FPIs sold $5.21 billion from Indian equities in June 2026. But BFSI turned net buyer at $3...

Amazon Now is targeting 100 Indian cities with 1,000+ micro-fulfilment centres. But the re...

RBI replaced its NBFC-UL scoring system with a single ₹1 lakh crore asset test on June 2...
Popular now
Learn how to easily download your NSDL CAS Statement in PDF format with our step-by-step g...
Learn what SIF investment means in India, SEBI rules, Rs 10 lakh minimum investment, avail...
Looking for the best financial freedom books? Here’s a handpicked 2026 reading list with...
Clear guide to mutual fund taxation in India for FY 2025–26 after July 2024 changes: equ...