
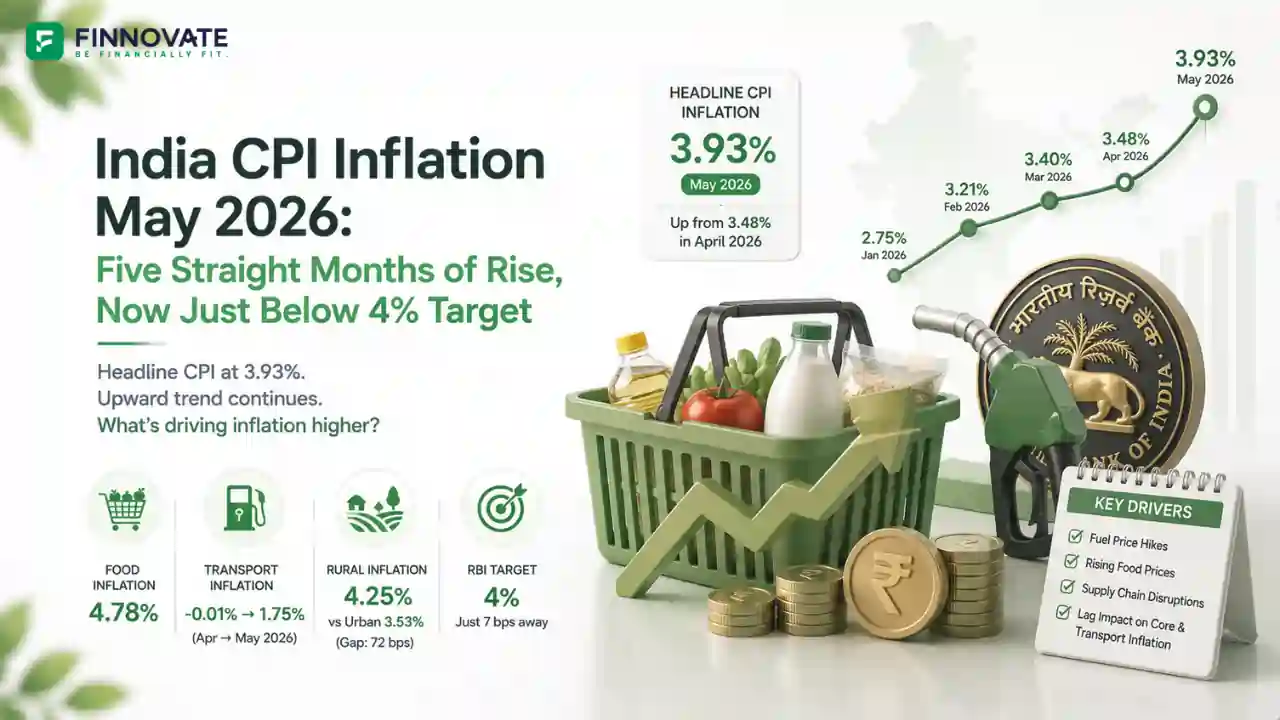
India CPI Inflation May 2026: 3.93%, Fifth Straight Monthly Rise
India's headline CPI rose to 3.93% in May 2026, food inflation hit 4.78%, and transport in...
16 June 2026
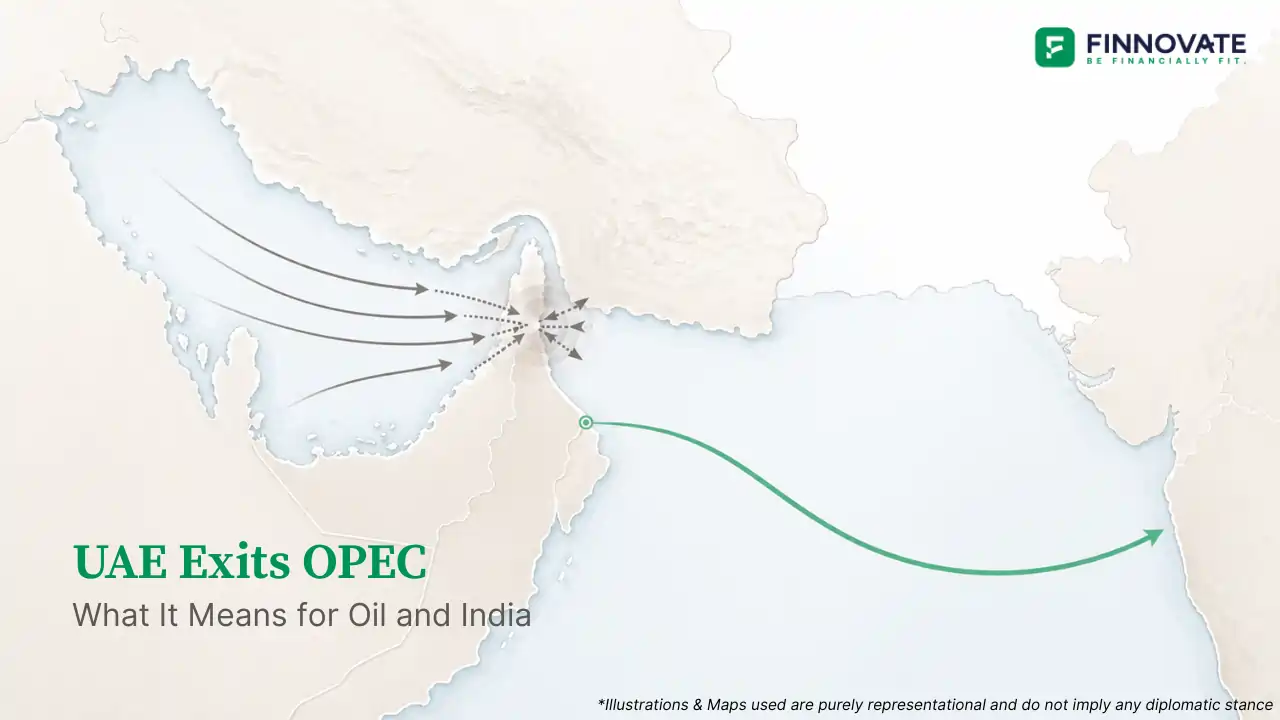
On April 29, 2026, the United Arab Emirates announced it was quitting OPEC and the broader OPEC+ alliance, effective May 1. The move ends a 59-year membership that began when Abu Dhabi joined the cartel in 1967. The UAE is OPEC's third-largest producer. Its exit was announced without consulting any other member country, including Saudi Arabia. It is not a dispute to be patched over. It is a strategic departure.
The timing is striking. The Gulf is in the middle of the worst energy shock since the 1970s. The Strait of Hormuz, through which roughly 20 million barrels of crude and oil products passed every day before the current conflict, is operating at a fraction of that capacity. The UAE cannot physically ship most of its oil regardless of whether it is in OPEC or not. In that sense, nothing changes at the pump today. But the structural implications of this exit stretch well beyond the current crisis, and they point directly at India. For Indian readers, this is not just an oil-market story. It has a bearing on inflation, fuel pricing, the rupee, and, through each of those, on investment portfolios.
This article explains why the UAE left, what it signals about OPEC's declining grip on global oil pricing, and how the chain of consequences connects to India's economy, its crude supply, and the portfolio context for Indian investors.
| Detail | Figure |
|---|---|
| UAE departure effective | May 1, 2026 |
| Years of OPEC membership | 59 years (since 1967) |
| UAE production capacity | 4.8 million barrels per day |
| UAE quota under OPEC | 3.2 million barrels per day |
| UAE actual output, March 2026 | 2.37 million barrels per day |
| Strait of Hormuz: normal daily oil flows | ~20 million barrels per day |
| Strait flows, early April 2026 | ~3.8 million barrels per day |
| OPEC's share of global supply | ~33 percent |
| OPEC+ (with non-OPEC allies) share | ~41 percent |
The UAE had the capacity to pump far more oil than OPEC allowed, and it has now freed itself from that constraint. The Strait of Hormuz crisis means it cannot act on that freedom immediately. But when the shipping routes normalise, an unconstrained UAE could add significant supply to the global market, which may ease the oil price pressure that India and most of the world is currently absorbing.
The official statement spoke of "national interests" and the UAE's "long-term strategic and economic vision." Energy Minister Suhail Mohamed al-Mazrouei confirmed the decision was made without raising it with any other country. Behind the diplomatic language are three distinct pressures that had been building for years.
OPEC's mechanism is simple: members agree to limit output collectively to support oil prices. For producers with low extraction costs and heavy investment in expanding capacity, this is increasingly a straitjacket rather than a strategy. The UAE has spent billions building infrastructure capable of pumping 4.8 million barrels per day. Under OPEC, it was permitted to produce 3.2 million. That difference, held back year after year while other members routinely exceeded their own quotas, represented billions in unrealised revenue. The resentment was not new. It had been building for years. The war simply removed the last reason to stay quiet.
The UAE is not leaving OPEC because it thinks oil has no future. It is leaving because it thinks OPEC's future is shorter than its own. The energy transition, however gradual, has a direction. Global oil demand is approaching its structural peak. A producer sitting on large, low-cost reserves faces a narrowing window to monetise them fully before demand begins a long, slow decline. The strategic choice is to maximise volume now, capture market share, and realise the asset before it depreciates. Saudi Arabia's approach is the opposite: restrict supply to hold prices high for as long as possible. These two strategies are fundamentally incompatible, and the UAE has now made its choice explicit.
The UAE and Saudi Arabia have been drifting apart for years. They backed opposing sides in Yemen. The UAE's Abraham Accords with Israel in 2020 opened a relationship with Tel Aviv and Washington that Saudi Arabia has not followed. During the Iran conflict, the UAE was targeted directly by Iranian drones, while Iran remained a nominal fellow OPEC member. The decision to announce the exit without consulting Riyadh was itself a statement. This is not a temporary disagreement about quotas. It reflects a genuine divergence in foreign policy, economic strategy, and risk calculus.
The UAE exit is the latest move in a longer pattern of attrition. Qatar left OPEC in 2019, citing its focus on liquefied natural gas over crude oil. Ecuador departed over quota frustrations. Angola exited in 2024 for similar reasons. Each departure has quietly reduced the cartel's ability to enforce production discipline and present a unified front.
OPEC's share of global oil supply has fallen from roughly half the market at its founding in 1960 to approximately 33 percent today. The rise of US shale, Norwegian output, and other non-OPEC producers has fundamentally shifted the pricing landscape. The cartel that once moved markets by adjusting a dial now controls less than a third of global supply.
OPEC+ broadened the alliance to include Russia, Kazakhstan, and ten other non-OPEC producers, bringing combined output control to around 41 percent. But enforcing discipline within that larger group has proven consistently difficult. Iraq, Kazakhstan, and Russia have repeatedly overproduced their agreed quotas, requiring compensation plans that are rarely fully executed.
Analysts have pointed to Nigeria as a potential future candidate. The Dangote refinery's growing capacity to process domestic crude locally reduces Nigeria's reliance on OPEC's price management strategy, weakening the case for quota compliance. Venezuela is another name mentioned by market watchers if its political environment continues shifting. These are structural observations based on the same incentive logic the UAE just acted on, not forecasts. The broader point is this: each exit that follows the UAE's weakens OPEC's collective pricing discipline further, and a cartel with declining membership and persistent internal cheating has progressively less ability to manage global oil prices. That shift in structural power, if it continues, changes the long-term calculus for oil as a variable in India's economy and investment environment.
OPEC's internal credibility has been strained for years by persistent quota overproduction. A country that abides by its cap while neighbours produce above theirs is effectively subsidising the price for violators. The more members cheat, the less value there is in staying honest. Andy Lipow of Lipow Oil Associates noted: "Countries that are tired of seeing their fellow OPEC and OPEC+ members consistently cheat on their quotas are candidates to leave these groups." The UAE's exit did not create this problem. It is a symptom of it.
The UAE exit matters structurally. But the oil market right now is not being moved by OPEC membership decisions. It is being moved by the Strait of Hormuz.
The Strait, a narrow waterway between Iran and Oman, is the single most critical oil transit chokepoint in the world. In 2025, approximately 20 percent of global oil consumption passed through it every day. There is no equivalent alternative. The options that exist are meaningful but not sufficient.
Three pipelines provide partial bypasses, but none can cover the gap alone:
| Route | Country | Capacity | Destination |
|---|---|---|---|
| East-West crude pipeline | Saudi Arabia | 5.0 million bpd | Yanbu, Red Sea |
| Abu Dhabi Crude Oil Pipeline | UAE | 1.8 million bpd | Fujairah, Gulf of Oman |
| Kirkuk-Ceyhan pipeline | Iraq | Via Turkey | Mediterranean |
| Combined alternative flow, April 2026 | All three | ~7.2 million bpd | Various |
| Pre-crisis Strait flows | Hormuz | ~20 million bpd | Global |
Even with all three routes running, the gap against pre-crisis Strait flows exceeds 13 million barrels per day. The alternative infrastructure was designed for partial contingency, not as a wholesale replacement.
The UAE exported approximately 1.7 million barrels per day through Fujairah in FY25, close to that pipeline's ceiling. Even without OPEC constraints, the UAE has no practical route to increase exports materially today. The bypass infrastructure was designed for partial contingency, not to replace the Strait entirely.
The moment the Strait reopens, an unconstrained UAE can begin ramping toward its 4.8 million barrels per day production capacity. That is when quota freedom translates into real additional barrels on the global market. Until then, the OPEC exit is primarily structural positioning. The Strait is the gate. OPEC membership is not.
India is the third-largest consumer of crude oil in the world. Three numbers define its exposure to this story:
| Metric | Figure |
|---|---|
| Daily crude consumption | ~5.5 million barrels per day |
| Share imported | More than 85 percent |
| Share normally through Strait of Hormuz | ~40 percent |
As of March 2026, India imports from around 40 source countries, and the government has maintained that domestic petroleum stocks remain stable. But stable supply and stable prices are different things.
The UAE has been one of India's most significant energy and trading partners for years. India's state-owned OMCs have active refining partnerships with ADNOC, the UAE's national oil company. The Comprehensive Economic Partnership Agreement signed in May 2022 formalised and deepened the bilateral relationship further. Merchandise trade between the two countries nearly doubled as a result, from USD 43.3 billion in FY21 to USD 83.7 billion in FY24. The scale of that trade signals how tightly the two economies are linked beyond crude alone.
A UAE no longer bound by OPEC production quotas is, in the medium term, a potentially higher-volume supplier to India. If post-war normalisation allows the UAE to ramp output significantly, India sits directly in the path of that additional supply as one of the UAE's closest and largest customers.
Brent crude is trading above $110 per barrel. For every $10 per barrel rise in crude prices, India's oil marketing companies absorb approximately Rs 6 per litre in losses on petrol and diesel, which have been held at pump prices frozen since April 2022. The OMC balance sheets are under sustained and accumulating pressure. Commercial LPG prices have already been raised twice during the conflict period.
Analysts at Emkay Global have estimated that a 10 percent hike in retail fuel prices now looks likely without a resolution of the Hormuz situation. The government clarified in late April 2026 that no immediate hike is planned, but the underlying arithmetic tightens with every week crude stays elevated.
If the Iran conflict resolves and the Strait reopens, an unconstrained UAE moving toward full production capacity could add meaningfully to global supply, depending on how quickly bypass and Strait infrastructure is restored. More volume from a low-cost, reliable producer reaching Asian markets through Fujairah may help ease the oil price environment over the medium term, though the pace and scale of that shift would depend on broader demand conditions and OPEC+ responses. India, given its deep bilateral energy ties with the UAE, could be among the beneficiaries of that shift through lower import costs and expanded refining cooperation.
Crude oil does not sit neatly in one sector of the economy. It moves through inflation, monetary policy, sector earnings, the currency, and specific asset classes. Each of these transmission paths is relevant for an Indian investor tracking this story.
Sustained crude above $100 per barrel feeds into consumer price inflation through fuel, transport logistics, and manufactured goods input costs. The RBI has projected CPI inflation at 4.0 percent in Q1 FY27 rising to 4.2 percent in Q2, with imported inflation cited as a key driver. The 125 basis points of rate cuts delivered through 2025 created a meaningful tailwind for long-duration debt funds. A prolonged hold in that rate cycle, driven by sticky inflation from elevated crude, reduces the scope for that tailwind to continue. The rate path for FY27 is directly tied to what happens to crude.
Not all sectors respond to crude the same way. The current environment reflects a clear divergence in sector earnings outlooks:
Under margin pressure: Aviation, paints, specialty chemicals, logistics, FMCG. These are sectors where input costs rise but consumer pricing faces resistance.
Historically more resilient: Domestic upstream producers, defence supply chains, infrastructure plays with limited exposure to global commodity input costs.
Historically, periods of sustained oil price elevation have been associated with rotation away from input-intensive sectors and toward the latter group.
Inflation driven by energy shocks has historically supported gold as a store of value. India's gold investment landscape has a specific tax development to note in FY2026-27: the capital gains tax exemption on Sovereign Gold Bonds now applies only to bonds purchased directly from the RBI at the time of original issue. For investors considering gold exposure in the current environment, gold ETFs and gold mutual funds may be the more structurally accessible routes. Finnovate's article on taxation of gold in India covers the full breakdown across instruments.
A high crude import bill widens India's current account deficit. A wider CAD puts pressure on the rupee. A weaker rupee raises the effective cost of dollar-denominated assets for Indian investors: international equity funds, children's foreign education, imported goods, and global insurance products. It also places the RBI in a difficult position between supporting domestic growth through monetary easing and managing external account stability.
The UAE left primarily because of a growing gap between its production capacity (4.8 million barrels per day) and the quota OPEC permitted it to pump (3.2 million barrels per day). Compounded by a strategic view that oil demand will peak in the coming decades and a foreign policy that has increasingly diverged from Saudi Arabia's, the case for remaining in the cartel had become untenable. The Iran war and direct attacks on UAE energy infrastructure removed the remaining incentive for restraint.
Not immediately. The Strait of Hormuz crisis is the dominant variable in oil pricing right now, and the UAE can only export approximately 1.7 to 1.8 million barrels per day through its Fujairah bypass regardless of its OPEC status. The scenario where the exit translates into lower prices is a post-conflict one: when the Strait reopens and the UAE can ramp toward its full production capacity, markets are likely to begin pricing that additional supply as clarity on conflict resolution improves.
India's exposure operates on two levels. In the near term, the Hormuz crisis is keeping crude elevated and putting pressure on India's import bill, OMC finances, and inflation. Over the medium term, a UAE free of production constraints could become a higher-volume crude supplier to India, particularly given the deep bilateral energy ties through CEPA and existing ADNOC-OMC refining partnerships.
The government clarified in late April 2026 that there are no immediate plans for a fuel price hike, even as pump prices have been frozen since April 2022. However, Brent above $110 per barrel is placing significant losses on oil marketing companies, and analysts have flagged the possibility of a price adjustment if crude remains elevated and the Hormuz situation does not resolve. Any future pricing decision rests with the government and the OMCs.
Crude prices transmit to mutual fund portfolios through multiple channels: higher inflation affects the RBI's rate path and the return outlook for long-duration debt funds; oil-sensitive equity sectors face margin compression that affects fund portfolios with exposure to those sectors; and gold-oriented funds may see tailwinds during energy-driven inflationary periods. Investors reviewing their portfolio allocation in this context may find it useful to consult a SEBI-registered investment adviser for guidance specific to their goals and risk profile.
OPEC's share of global oil supply has declined from roughly half the market at its founding to approximately 33 percent today, and the UAE exit continues a pattern of departures that includes Qatar in 2019 and Angola in 2024. However, OPEC+ still controls around 41 percent of global supply and demonstrated meaningful pricing power as recently as 2022-23. Whether the cartel remains influential depends on how well Saudi Arabia and the remaining core members hold quota discipline in the years ahead.
Disclaimer: This article is for general information and educational purposes only. It does not constitute investment advice, a recommendation, or an offer to buy or sell any securities or financial instruments. Energy market data, oil price figures, production statistics, and trade data referenced in this article are sourced from the IEA Oil Market Report (April 2026), EIA, Al Jazeera, CNBC, India Briefing, and government sources, and are subject to revision. RBI inflation projections are based on publicly available RBI communications. Past market behaviour and commodity price patterns are not indicative of future outcomes. Please consult a SEBI-registered investment adviser or qualified financial professional before making any investment decision. Mutual fund and equity investments are subject to market risks. Please read all related documents carefully before investing.
No spam. Only new posts, simple explainers, and practical money checklists for busy professionals.
Finnovate is a SEBI-registered financial planning firm that helps professionals bring structure and purpose to their money. Over 3,500+ families have trusted our disciplined process to plan their goals - safely, surely, and swiftly.
Our team constantly tracks market trends, policy changes, and investment opportunities like the ones featured in this Weekly Capsule - to help you make informed, confident financial decisions.
Learn more about our approach and how we work with you:


No spam. Only new posts, simple explainers, and practical money checklists.
You may also like
India's headline CPI rose to 3.93% in May 2026, food inflation hit 4.78%, and transport in...
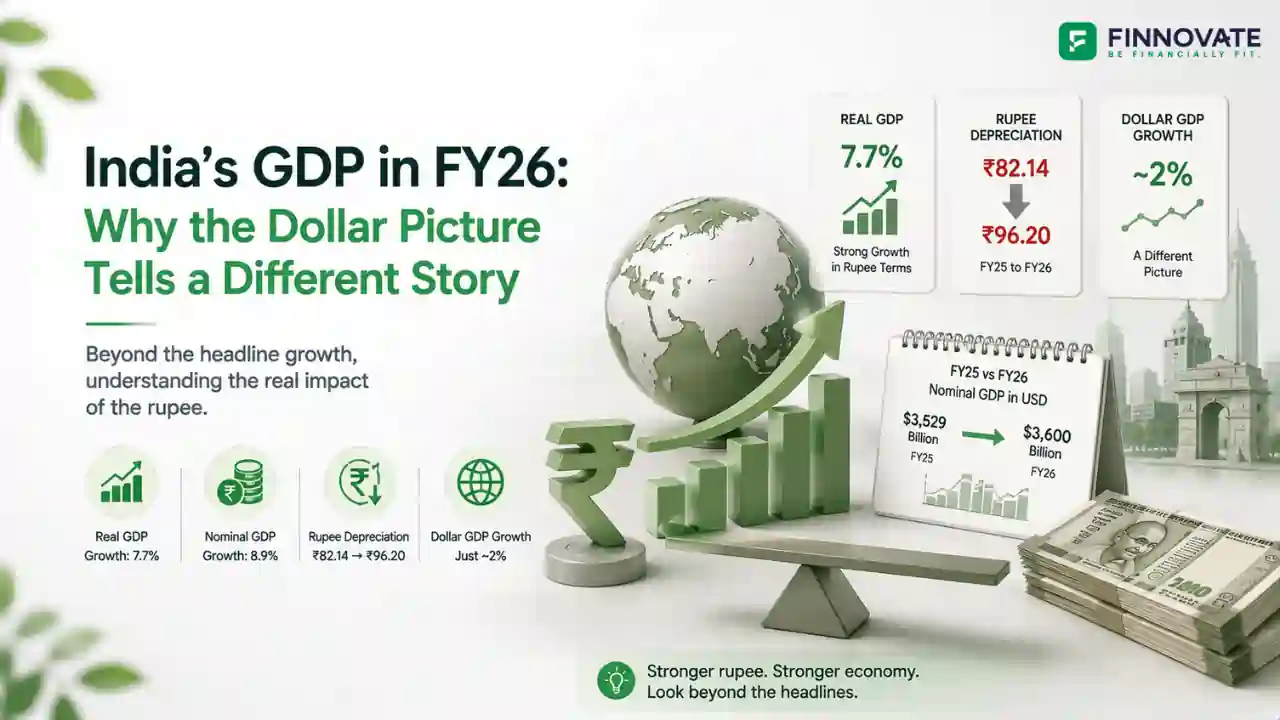
India's real GDP grew 7.7% in FY26. But nominal GDP in dollar terms grew roughly 2% over t...
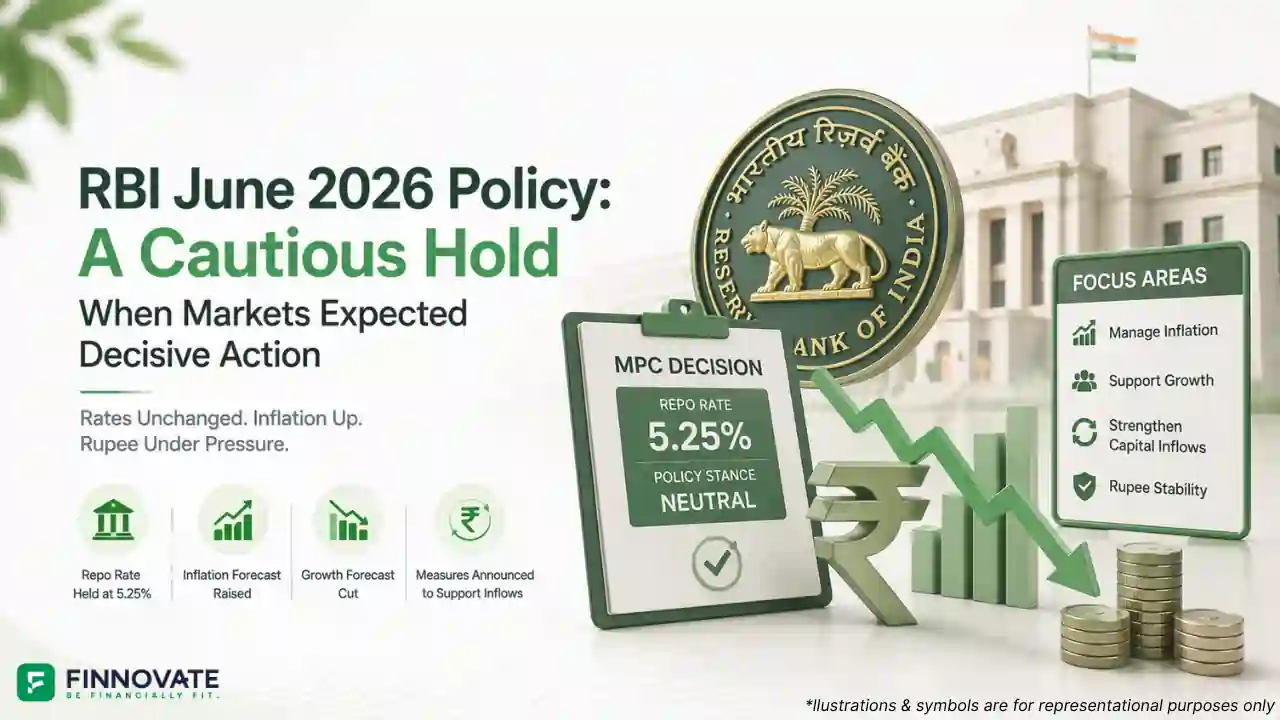
The RBI held rates at 5.25% on June 5, 2026 with neutral stance as the rupee hit near ₹9...

Airtel launched India's first commercial 5G slicing service on May 19, 2026. Priority Post...
Popular now
Learn how to easily download your NSDL CAS Statement in PDF format with our step-by-step g...
Learn what SIF investment means in India, SEBI rules, Rs 10 lakh minimum investment, avail...
Looking for the best financial freedom books? Here’s a handpicked 2026 reading list with...
Clear guide to mutual fund taxation in India for FY 2025–26 after July 2024 changes: equ...