
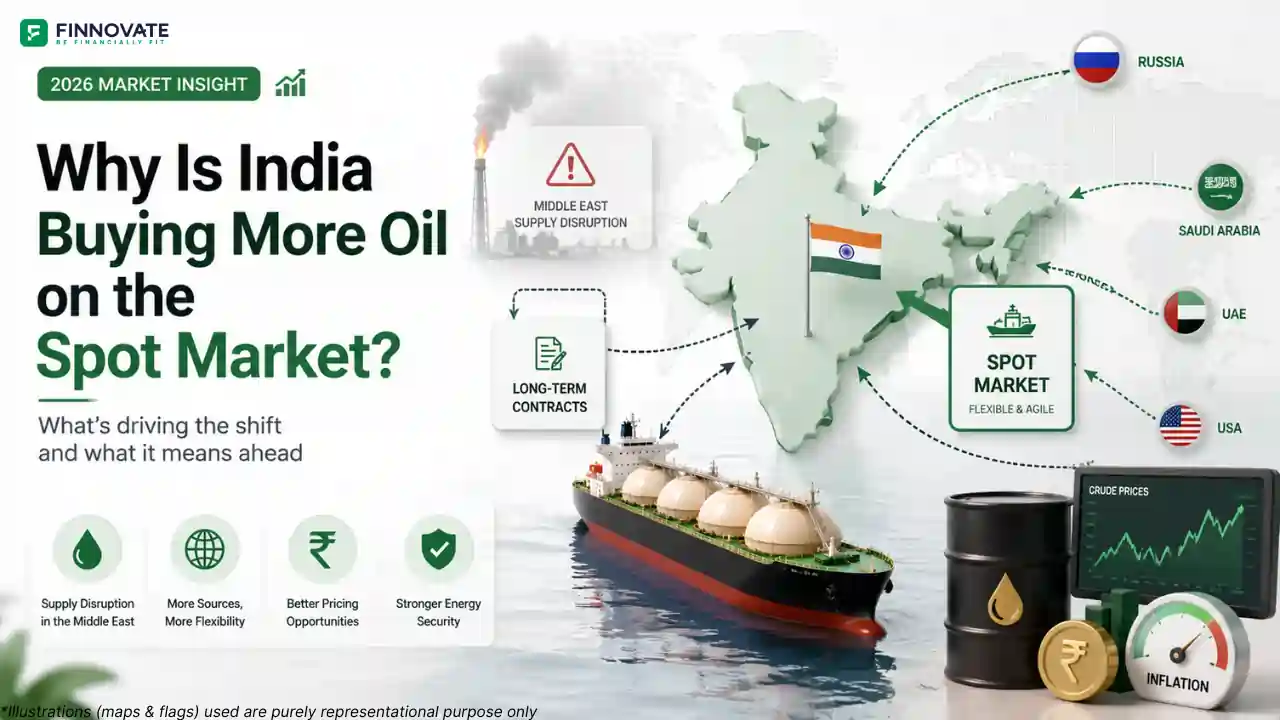
Why India Is Buying More Oil on the Spot Market After the 2026 Middle East Crisis
India's crude imports shifted fast after the 2026 Iran war. Russia's share hit 52-54% by J...
09 July 2026
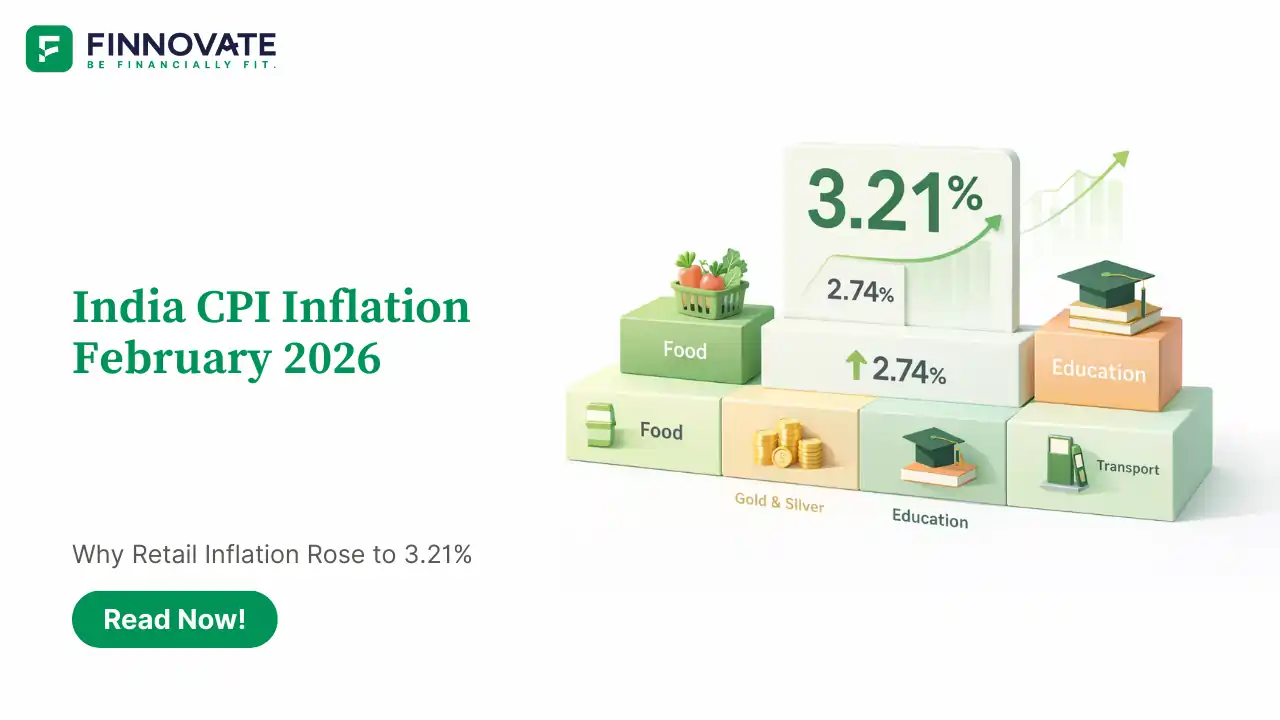
India’s CPI inflation for February 2026 came in at 3.21%, up from 2.74% in January. On the face of it, that looks like a clear rise in retail inflation. But this number needs to be read with one important change in mind: India has now shifted to a new CPI series with a revised base year and a reworked consumption basket.
That is why the February print is not just a simple inflation uptick. Part of the rise reflects actual movement in prices across food, services, and precious-metals-linked items. Part of it also reflects how inflation is now being measured under the new series. So the right question is not only whether inflation moved up, but also what exactly pushed it higher this time.
Headline CPI inflation stood at 3.21% in February 2026, with rural inflation at 3.37% and urban inflation at 3.02%. In January 2026, the final reading was 2.74%, with rural at 2.73% and urban at 2.75%. That means headline inflation rose by 47 basis points in just one month.
This was only the second reading under the revised CPI structure. So while inflation has clearly moved higher, comparisons with older inflation behaviour need some care. The index is now working with a new base year, new weights, and a more detailed classification framework. That means even when price pressures look familiar, the headline outcome can behave somewhat differently from the old series.
The new CPI series uses 2024 as the base year. It has been built using the Household Consumption Expenditure Survey 2023–24 and reorganises the basket into 12 divisions under a newer classification structure.
The biggest practical change is in weights. Food and beverages remains the largest component in CPI, but its weight has fallen sharply from 45.86% in the earlier CPI 2012 series to 36.75% in the new CPI 2024 series. That is a drop of 9.11 percentage points.
Why does that matter? Because food had been one of the biggest reasons headline inflation stayed soft in recent months. Once food gets a lower weight, that disinflation effect naturally becomes smaller. In other words, even if food prices remain relatively controlled, they no longer pull down the overall CPI as strongly as before.
The revised series also gives more structure to categories like health, education, housing-related services, restaurants, communication, and personal care. So this is not only a technical rebasing exercise. It is also an attempt to reflect how Indian household consumption has changed over time.
The sharpest inflation pressure came from the basket officially called personal care, social protection and miscellaneous goods and services, which recorded inflation of 19.64% in February. This was by far the hottest category in the CPI basket and was heavily influenced by high prices in gold- and silver-linked items.
Among the broader everyday categories, food and beverages inflation stood at 3.35%. Education services came in at 3.33%, paan, tobacco and intoxicants at 3.49%, and restaurants and accommodation at 2.73%. Clothing and footwear inflation was 2.81%, health was 1.90%, and housing, water, electricity, gas and other fuels stood at 1.52%.
One important relief point came from transport, where inflation remained at -0.05%. That helped offset some of the upward pressure from food and precious metals. So this was not a broad-based inflation shock across every major category. The February number was shaped by selective pressure points rather than uniform overheating.
| CPI Basket (Feb-26) | Rural Inflation | Urban Inflation | Headline Inflation |
|---|---|---|---|
| Food & Beverages | 3.36% | 3.33% | 3.35% |
| Paan, Tobacco, Intoxicants | 3.47% | 3.56% | 3.49% |
| Clothing & Footwear | 3.24% | 2.11% | 2.81% |
| Housing, Water, Power, Gas | 1.33% | 1.63% | 1.52% |
| Furnishing, Home Equipment | 1.55% | 1.21% | 1.40% |
| Health | 1.77% | 2.10% | 1.90% |
| Transport | -0.05% | -0.05% | -0.05% |
| Information & Communication | 0.32% | 0.15% | 0.25% |
| Recreation, Sports, Culture | 1.99% | 2.42% | 2.21% |
| Education Services | 3.00% | 3.54% | 3.33% |
| Restaurants & Accommodation | 2.02% | 3.35% | 2.73% |
| Personal Care, Gold, Silver* | 20.60% | 18.40% | 19.64% |
| All-India Inflation | 3.37% | 3.02% | 3.21% |
Rural inflation at 3.37% was higher than urban inflation at 3.02% in February. That gap is not very wide, but it still shows that inflation pressure was not evenly distributed.
Rural inflation was higher in clothing and footwear, information and communication, and especially in the personal care and precious-metals-linked basket, where rural inflation was 20.60% compared with 18.40% in urban India. Urban inflation, on the other hand, was higher in health, education services, restaurants and accommodation, recreation, and paan, tobacco and intoxicants.
This split gives a useful signal. Urban inflation is still showing stronger pressure in several service-oriented categories. Rural inflation, meanwhile, is showing sharper movement in a few goods-linked areas, especially where precious metals are involved. That tells us the inflation story is becoming more mixed and more category-specific than before.
Food was one of the main drivers. The broader all-India food inflation measure rose to 3.47% in February from 2.13% in January. That alone helps explain why headline CPI moved up.
At the item level, a few products helped contain inflation. Garlic, onion, potato, and arhar/tur showed strong deflation and provided some relief. On the other side, silver jewellery, gold and other jewellery items, copra, tomato, and cauliflower remained the key high-inflation items in February.
Transport staying negative also mattered. It suggests that direct pass-through from global oil into the official CPI transport basket remained limited in February. But limited direct pass-through is not the same as zero risk. If crude stays high for longer, inflation can still rise through freight, packaging, downstream products, and broader input costs. That is the part markets are likely watching more closely now.
The next phase of inflation will likely depend on four variables.
The first is food. Food inflation is back in positive territory, but it is still not running at an alarming level. The next major test will be the monsoon and how it shapes the kharif crop cycle. The second is crude oil. If global oil prices remain elevated, the inflation effect may spread beyond direct fuel pricing into a wider set of goods and services. The third is precious metals. Gold and silver have remained major inflation drivers within the personal care and miscellaneous basket, and that pressure has not faded yet. The fourth is the new series itself. Because this series has only just started, the next few readings will matter a lot for understanding the new inflation pattern more clearly.
So the February print does not point to runaway inflation. But it does suggest that inflation may not remain as soft as earlier readings had made it look, especially if food and commodity-linked pressures stay firm.
At 3.21%, CPI inflation is still below the RBI’s 4% medium-term target. So this is not a number that, by itself, completely changes the policy picture. But it does reduce some of the comfort that came from very soft inflation readings earlier.
For bond markets, the issue is broader than one month’s CPI print. Rising inflation, high oil risk, and the possibility of delayed pass-through into domestic prices can all make long-duration bonds more sensitive. That is one reason bond yields have stayed alert to inflation and crude developments.
For markets overall, the message is fairly simple. Inflation is still under control, but the direction has become less comfortable. That means bond yields, RBI expectations, and oil-sensitive sectors may remain closely linked over the next few weeks.
Because food inflation moved higher, the new CPI series changed the weight structure, and precious-metals-linked inflation remained very high in the personal care and miscellaneous basket.
It changed how inflation is measured by revising the base year to 2024 and lowering the food weight. That does not automatically raise every print, but it does change how headline CPI behaves compared with the older series.
Food and beverages, education services, restaurants and accommodation, and especially the personal care and miscellaneous basket were the main upward drivers, while transport remained negative.
Rural inflation was higher overall, while urban inflation was stronger in several service-linked categories such as health, education, and restaurants.
Food prices, monsoon conditions, crude oil, precious metals, bond yields, and whether indirect fuel pass-through starts showing up more clearly in the next few readings.
Disclaimer: This article is for general information and educational purposes only. It does not constitute investment, tax, legal, or financial advice. Market conditions, policy signals, and economic data can change quickly. Please refer to official sources or speak to a qualified professional before taking action.
No spam. Only new posts, simple explainers, and practical money checklists for busy professionals.
Finnovate is a SEBI-registered financial planning firm that helps professionals bring structure and purpose to their money. Over 3,500+ families have trusted our disciplined process to plan their goals - safely, surely, and swiftly.
Our team constantly tracks market trends, policy changes, and investment opportunities like the ones featured in this Weekly Capsule - to help you make informed, confident financial decisions.
Learn more about our approach and how we work with you:


No spam. Only new posts, simple explainers, and practical money checklists.
You may also like
India's crude imports shifted fast after the 2026 Iran war. Russia's share hit 52-54% by J...
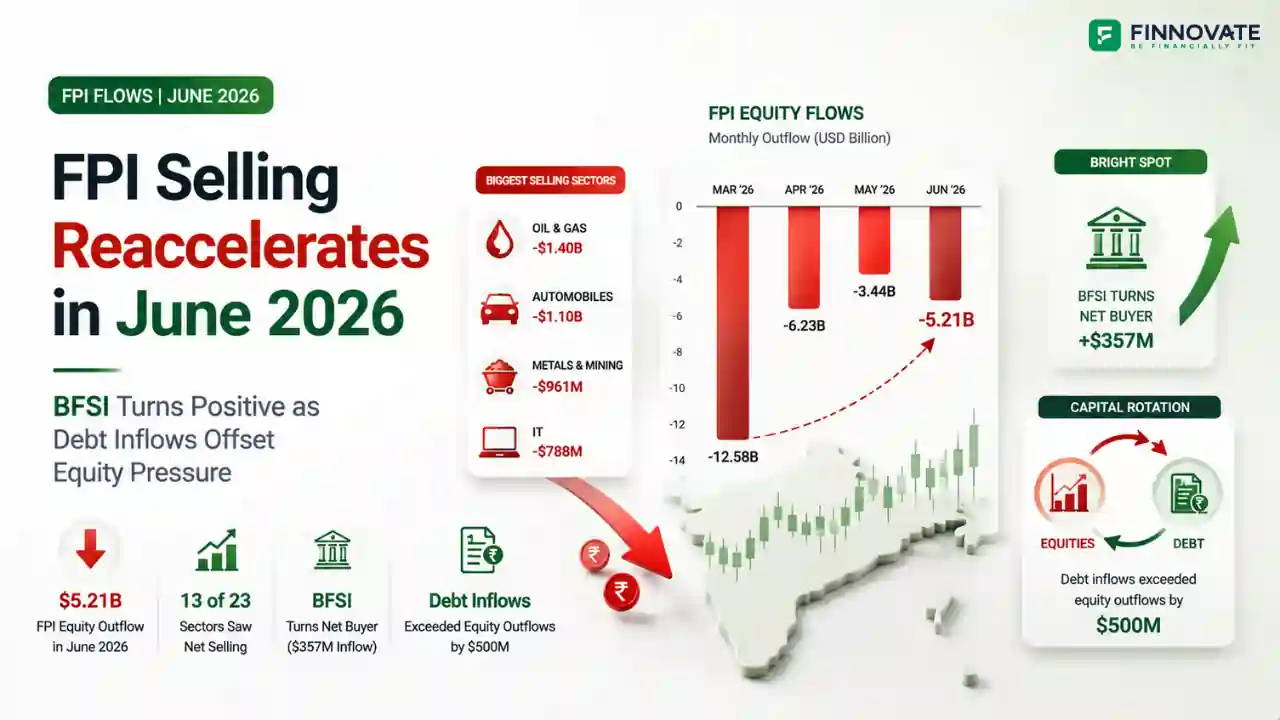
FPIs sold $5.21 billion from Indian equities in June 2026. But BFSI turned net buyer at $3...

Amazon Now is targeting 100 Indian cities with 1,000+ micro-fulfilment centres. But the re...
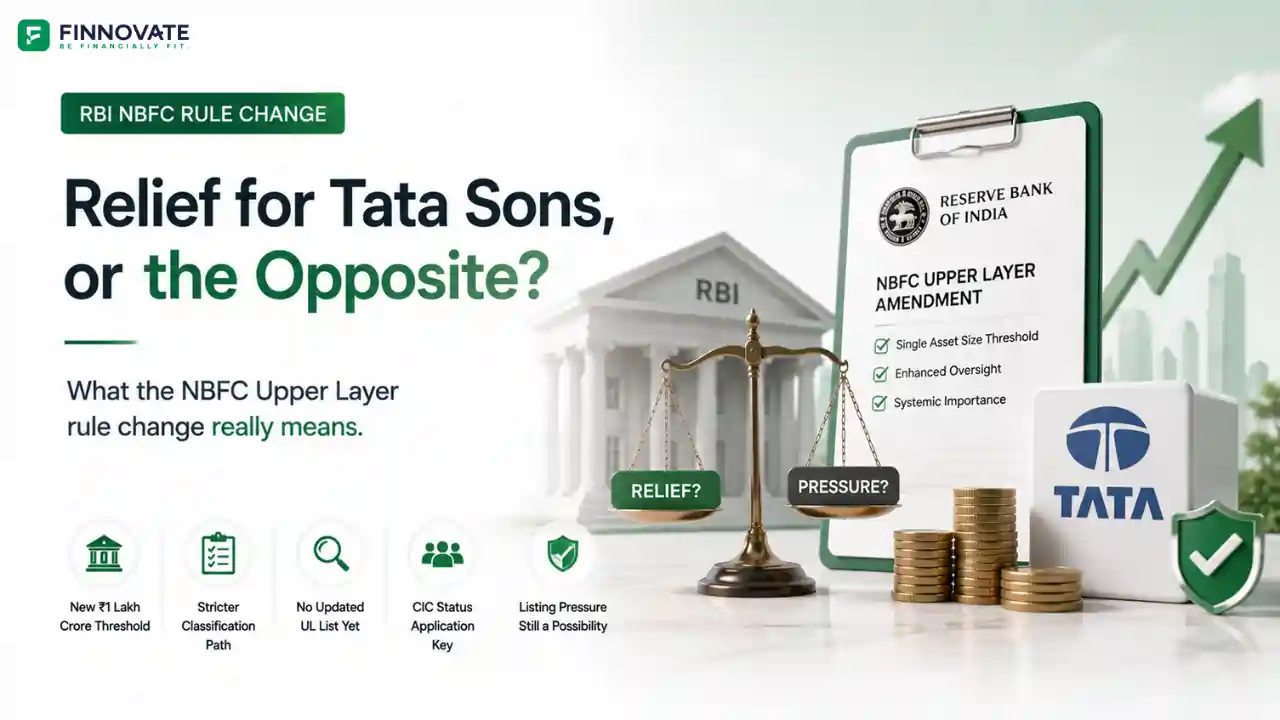
RBI replaced its NBFC-UL scoring system with a single ₹1 lakh crore asset test on June 2...
Popular now
Learn how to easily download your NSDL CAS Statement in PDF format with our step-by-step g...
Learn what SIF investment means in India, SEBI rules, Rs 10 lakh minimum investment, avail...
Looking for the best financial freedom books? Here’s a handpicked 2026 reading list with...
Clear guide to mutual fund taxation in India for FY 2025–26 after July 2024 changes: equ...