
SIP Stability or Stagnation: What the 2026 AMFI Data Actually Shows
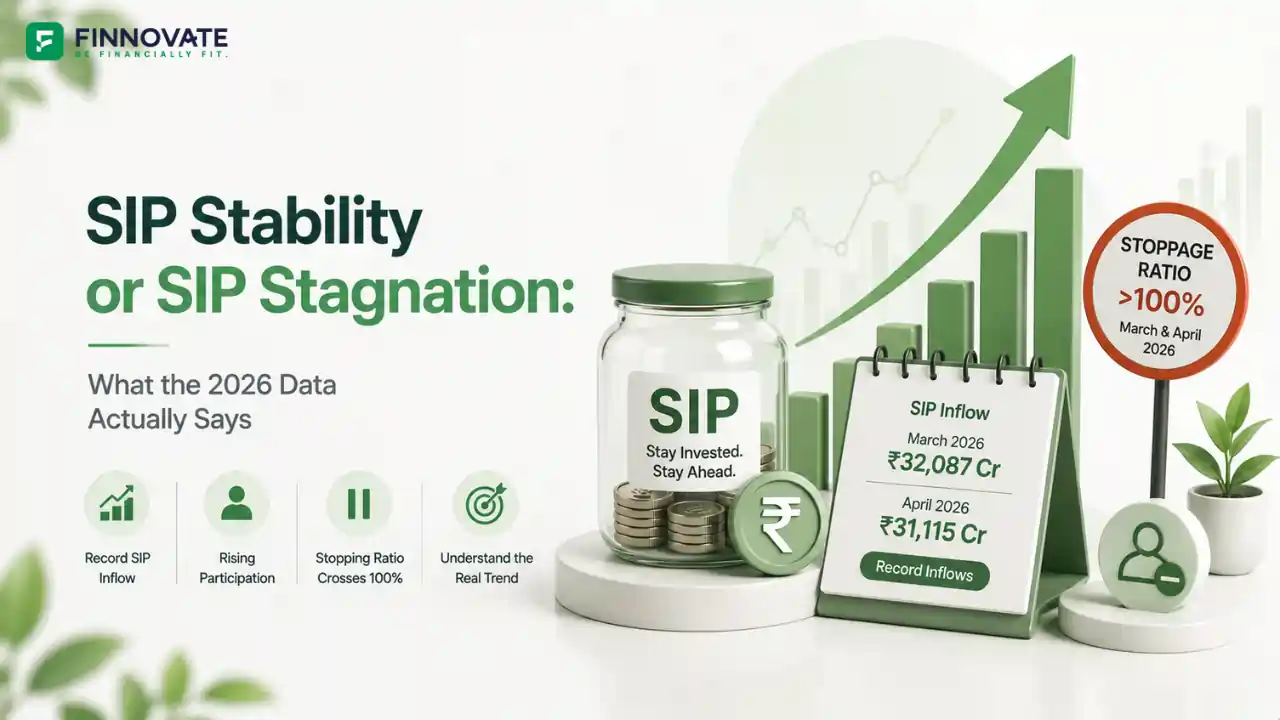
SIP inflows hit a record ₹32,087 crore in March 2026. Yet the stoppage ratio crossed 100...
01 June 2026

After an abnormal spike due to SEBI's retrospective rules, SIP trends are back to normal - and more reliable
In the world of mutual funds, Systematic Investment Plans (SIPs) have become the go-to route for retail investors. But like any recurring investment, SIPs too get discontinued for various reasons - some intentional, some systemic.
One useful metric that tracks this behavior is the SIP stoppage ratio: It is defined as:
Historically, this ratio hovers between 45% to 50%. During the COVID-19 pandemic, it rose sharply above 65%, as many investors paused or exited their SIPs due to financial uncertainty.
But in early 2025, the stoppage ratio spiked to over 350%, raising eyebrows. Was investor confidence collapsing? Not quite.
Let’s break it down.
Between December 2024 and April 2025, the SIP stoppage ratio saw a sharp and unusual rise, peaking at 352.79% in April 2025. But the cause wasn’t panic selling or market exits - it was data correction.
Here’s what happened:
These weren’t fresh investor exits - but long-dead SIPs finally being cleaned up. The spike in discontinuations was technical, not behavioral.
Let’s examine how the stoppage ratio and contributing SIP folios changed month over month.
| Month | New SIPs (Lakh) | Discontinued SIPs (Lakh) | Stoppage Ratio (%) | Outstanding SIP Folios (Lakh) | Contributing Folios (Lakh) | Contribution Ratio (%) |
|---|---|---|---|---|---|---|
| May-25 | 59.15 | 42.66 | 72.12 | 905.57 | 856.00 | 94.53 |
| Apr-25 | 46.01 | 162.32 | 352.79 | 889.08 | 838.25 | 94.28 |
| Mar-25 | 40.19 | 51.55 | 128.27 | 1,005.39 | 811.16 | 80.68 |
| Feb-25 | 44.56 | 54.70 | 122.76 | 1,016.75 | 826.41 | 81.28 |
| Jan-25 | 56.19 | 61.33 | 109.15 | 1,026.89 | 834.97 | 81.31 |
| Dec-24 | 54.27 | 44.91 | 82.75 | 1,032.03 | 827.44 | 80.18 |
Source: Association of Mutual Funds in India (AMFI), Monthly data for April–May 2025. View original data here.

The contributing SIP ratio is defined as:
This is now the more meaningful number for fund houses and advisors. As of May 2025:
This is the highest level in over a year, and it’s a positive structural shift, not a temporary recovery.
For long-term mutual fund investors, this clean-up is a good thing.
Don’t let the April 2025 spike confuse you - it was a technical anomaly, not a sign of falling investor trust.
Let Finnovate Help You Stay on Track
Book a free session with our expert team to ensure your SIPs align with your financial goals - even during policy or market changes.
Book Your Free Call NowDisclaimer: The content in this article is for informational and educational purposes only. It should not be construed as investment advice. Please consult a qualified financial advisor before making any investment decisions.
No spam. Only new posts, simple explainers, and practical money checklists for busy professionals.
Finnovate is a SEBI-registered financial planning firm that helps professionals bring structure and purpose to their money. Over 3,500+ families have trusted our disciplined process to plan their goals - safely, surely, and swiftly.
Our team constantly tracks market trends, policy changes, and investment opportunities like the ones featured in this Weekly Capsule - to help you make informed, confident financial decisions.
Learn more about our approach and how we work with you:


No spam. Only new posts, simple explainers, and practical money checklists.
You may also like
SIP inflows hit a record ₹32,087 crore in March 2026. Yet the stoppage ratio crossed 100...

India's household savings in equities and MFs rose from 2% to 15.2% between FY12 and FY25,...

Mutual fund AUM jumped 11% to ₹81.92 lakh crore in April 2026. But 60% of the ₹8.19 la...

Passive fund flows hit Rs 20,082 crore in April 2026, down 33% from March. Equity passive ...
Popular now
Learn how to easily download your NSDL CAS Statement in PDF format with our step-by-step g...
Learn what SIF investment means in India, SEBI rules, Rs 10 lakh minimum investment, avail...
Looking for the best financial freedom books? Here’s a handpicked 2026 reading list with...
Clear guide to mutual fund taxation in India for FY 2025–26 after July 2024 changes: equ...