

Which Equity Fund Categories Grew the Fastest Over 3 Years?
Equity fund folios grew 22.96% CAGR and AUM 29.69% over 3 years. See which of the 11 categ...
08 July 2026

Most investors check their portfolio returns. Very few step back and ask a different question: which parts of the mutual fund industry itself have grown the most, and what does that say about how Indian investor behaviour has actually changed?
Three years is the right window for that question. It is long enough to look past a single market cycle, a single RBI rate move, or a single year of gold outperforming equities. A three-year CAGR captures both sustained flows and the mark-to-market effects of asset price movements. It tells you where money genuinely went, and stayed.
Here is what AMFI data for February 2026 versus February 2023 shows, restricted to fund categories with at least ₹1 lakh crore in AUM as of February 2026. The list includes 1 debt fund category, 3 passive categories, 2 hybrid categories, and 7 active equity categories.
| Fund Category | Feb-23 AUM (₹ Cr) | Feb-26 AUM (₹ Cr) | Value Shift (₹ Cr) | 3-Year CAGR |
|---|---|---|---|---|
| Broad Categories | ||||
| Equity Funds | 15,01,778 | 35,39,476 | 20,37,698 | 33.08% |
| Passive Funds | 6,63,883 | 15,23,697 | 8,59,814 | 31.91% |
| Hybrid Funds | 4,87,415 | 11,13,099 | 6,25,684 | 31.69% |
| Specific Categories - Ranked by 3-Year CAGR | ||||
| Gold ETFs | 21,400 | 1,83,325 | 1,61,925 | 104.61% |
| Multi-Asset Allocation Funds | 25,948 | 1,83,246 | 1,57,298 | 91.86% |
| Arbitrage Funds | 77,229 | 2,73,569 | 1,96,340 | 52.44% |
| Multi-Cap Funds | 66,875 | 2,21,586 | 1,54,711 | 49.08% |
| Sectoral / Thematic Funds | 1,68,775 | 5,29,804 | 3,61,029 | 46.42% |
| Money Market Funds | 1,18,620 | 3,40,401 | 2,21,781 | 42.11% |
| Small-Cap Funds | 1,31,568 | 3,63,537 | 2,31,969 | 40.32% |
| Large & Mid-Cap Funds | 1,26,648 | 3,31,893 | 2,05,245 | 37.87% |
| Mid-Cap Funds | 1,83,246 | 4,62,098 | 2,78,852 | 36.11% |
| Value / Contra Funds | 89,510 | 2,15,265 | 1,25,755 | 33.98% |
| Index Funds | 1,38,814 | 3,24,567 | 1,85,753 | 32.73% |
| Flexi-Cap Funds | 2,40,791 | 5,53,187 | 3,12,396 | 31.95% |
| Index ETFs | 4,81,776 | 9,76,208 | 4,94,432 | 26.54% |
3 Key Observations Before We Go Category by Category:
Let's start with the broad categories, because they set the context for everything else.
Equity funds grew at a three-year CAGR of 33.08%, with AUM rising from ₹15.02 lakh crore to ₹35.39 lakh crore. Passive funds came in at 31.91%, climbing from ₹6.64 lakh crore to ₹15.24 lakh crore. Hybrid funds tracked closely at 31.69%, moving from ₹4.87 lakh crore to ₹11.13 lakh crore.
Three structurally different categories, almost identical growth rates over three years. That is not coincidence. It reflects broad-based structural expansion in mutual fund participation, not a story driven by a single theme or category.
Debt funds did not match this pace. The primary reason is not a lack of investor interest in debt, but the quarterly cyclicality created by advance tax payouts. These create large, predictable redemptions at regular intervals through the financial year, which mechanically suppresses long-term CAGR even when underlying investor demand is stable.
Passive and hybrid funds have clearly moved from being complementary allocations in an equity-centric portfolio to being substantial investment destinations in their own right. For investors looking to understand how to select and position around passive funds in a portfolio, we have covered that in detail separately.
Gold ETFs grew at a three-year CAGR of 104.61%, taking AUM from roughly ₹21,400 crore to ₹1,83,325 crore. Multi-Asset Allocation Funds grew at 91.86%, rising from approximately ₹25,948 crore to ₹1,83,246 crore. Both nearly doubled in size on a CAGR basis and both crossed ₹1.83 lakh crore in AUM. The symmetry is not accidental.
Two factors explain the pace of growth in both categories.
Base effect. Both categories started from relatively small bases in February 2023. When starting AUM is modest, percentage growth is structurally amplified. A category growing from ₹20,000 crore to ₹1.8 lakh crore produces a very different CAGR than one growing from ₹2.4 lakh crore to ₹5.5 lakh crore, even if the absolute rupee addition is comparable.
Gold price appreciation. Gold prices rose sharply through 2024 and 2025, one of the strongest sustained runs for the metal in recent years. This boosted Gold ETF AUM through mark-to-market gains and drew fresh investor interest in commodity exposure as equity markets remained volatile.
Multi-Asset Allocation Funds benefited from the same dynamic. Gold is a structural component of the multi-asset mandate, and its appreciation contributed directly to MAAF returns and to fresh investor interest in a product that offered diversification across equity, debt, and commodities within one structure. Both categories were, in different proportions, gold beneficiaries.
Investors who want to understand how Gold ETFs are taxed versus other gold formats will find the rules around holding periods and capital gains rates covered in detail separately.
Arbitrage funds grew at a three-year CAGR of 52.44%, with AUM rising from ₹77,229 crore to ₹2,73,569 crore. For a category that was once seen as primarily institutional and niche, that is a meaningful shift in scale and breadth.
The demand is structural, not tactical. It is rooted in how arbitrage funds are taxed relative to other short-duration products:
That post-tax gap is why arbitrage funds have increasingly become a preferred parking vehicle for surplus funds among institutional and HNI investors. The three-year AUM growth reflects this preference shift, not a one-off tactical rotation.
It is worth noting that returns depend on the availability of spread opportunities between the cash and futures markets. When spreads compress, returns can narrow. Investors should align their expectations and holding periods accordingly.
Out of the entire debt fund universe, only money market funds appear in this analysis, with a three-year CAGR of 42.11%, taking AUM from ₹1,18,620 crore to ₹3,40,401 crore.
Money market funds invest at the short end of the yield curve, primarily in commercial papers, treasury bills, and certificates of deposit, with average portfolio maturities of around one year.
What worked in their favour was a specific rate environment. Short-term yields rose sharply from early 2023 as the RBI tightened monetary policy, making money market funds a genuine yield pickup over savings accounts and other very short-duration instruments for institutional and corporate treasury investors parking surplus funds.
As the RBI subsequently moved toward easing from 2025 onwards, yield levels moderated. But money market funds continued to attract flows given their relative stability, liquidity, and utility as a cash management tool. No other debt category in the ₹1 lakh crore-plus AUM club matched this pace over three years. That is a clear signal of where short-duration debt appetite was concentrated through this rate cycle.
The seven equity categories on this list do not represent a single homogeneous trend. They split cleanly into two investor motivations.
Investors seeking returns beyond benchmark-level equity exposure:
These categories drew investors prepared to take on higher concentration or volatility risk in exchange for the possibility of returns above what large-cap or index-linked funds typically deliver. The strong performance of mid- and small-cap segments over parts of this period sustained flows and kept AUM growing.
Investors seeking broader equity exposure with mandate flexibility:
These categories attracted investors who wanted diversified equity participation across market capitalisation segments, without the concentration risk of a single-segment bet. The appeal was flexibility and diversification within a single mandate, which became more valuable in a market environment marked by rotation across large, mid, and small-cap stocks.
Both clusters grew strongly, but for distinct investor reasons. What they share is that neither is a pure large-cap play.
Large-cap active funds are absent from this analysis, and the absence is meaningful.
Investors seeking large-cap beta - participation in the broad direction of large-cap markets - have increasingly moved toward index funds and index ETFs, which offer that exposure at structurally lower cost. Active large-cap funds have historically found it difficult to consistently outperform their benchmarks after fees, where markets are relatively efficient and analyst coverage is dense. The case for active versus passive portfolio management goes deeper than just fees, and we have covered both sides of that argument separately.
Index funds grew at a three-year CAGR of 32.73%, taking AUM from ₹1,38,814 crore to ₹3,24,567 crore. Index ETFs grew at 26.54%, with AUM rising from ₹4,81,776 crore to ₹9,76,208 crore. Both carry large absolute AUM bases, and their sustained growth reflects a real and growing preference for passive routes to large-cap equity exposure.
For large-cap equity, the default choice among Indian investors appears to be gradually shifting toward passive. We looked at whether this passive shift is structural or momentum-driven in a separate piece, and the answer is more nuanced than the flow numbers suggest.
Among categories with at least ₹1 lakh crore in AUM, Gold ETFs led with a three-year CAGR of 104.61%, followed by Multi-Asset Allocation Funds at 91.86%. Both benefited from gold price appreciation and growing investor interest in commodity-linked exposure.
No. High historical CAGR reflects a specific set of conditions, including low starting base and favourable asset price movements, that may not repeat. Past AUM growth is not a predictor of future growth. Investors should evaluate fund categories based on their own financial goals, risk profile, and investment horizon.
Arbitrage funds offer equity-style taxation while delivering debt-like risk levels. For investors in higher tax brackets, this post-tax advantage over liquid funds is meaningful and structural. That tax efficiency, more than return performance, has driven the category's sustained AUM growth.
RBI tightening from early 2023 pushed short-term yields higher, making money market funds more attractive for institutional and corporate treasury investors. That elevated yield environment, combined with strong liquidity and low duration risk, drove consistent inflows into the category through this period.
Not replacing, but complementing more meaningfully than before. The shift is most visible in large-cap equity, where passive index funds and ETFs are increasingly preferred over active funds. In mid-cap, small-cap, and thematic segments, active funds still dominate and continue to attract strong flows.
Multi-Asset Allocation Funds within the hybrid category grew at 91.86% CAGR, which pulled the overall hybrid category higher. Beyond that, volatile market conditions made dynamically allocated hybrid structures more attractive to investors looking for managed diversification rather than pure equity exposure.
Disclaimer: This article is for general information and educational purposes only. It does not constitute investment, tax, legal, or financial advice. All AUM figures and CAGR calculations referenced in this article are based on publicly available data published by AMFI and are subject to revision. Past AUM growth, past fund category performance, and historical CAGR figures are not indicative of future growth, returns, or performance of any mutual fund or fund category. Investors should not make investment decisions based on this article. Please consult a SEBI-registered investment adviser or a qualified financial professional before making any investment or financial decision. Mutual fund investments are subject to market risks. Please read all scheme-related documents carefully before investing.
No spam. Only new posts, simple explainers, and practical money checklists for busy professionals.
Finnovate is a SEBI-registered financial planning firm that helps professionals bring structure and purpose to their money. Over 3,500+ families have trusted our disciplined process to plan their goals - safely, surely, and swiftly.
Our team constantly tracks market trends, policy changes, and investment opportunities like the ones featured in this Weekly Capsule - to help you make informed, confident financial decisions.
Learn more about our approach and how we work with you:


No spam. Only new posts, simple explainers, and practical money checklists.
You may also like
Equity fund folios grew 22.96% CAGR and AUM 29.69% over 3 years. See which of the 11 categ...
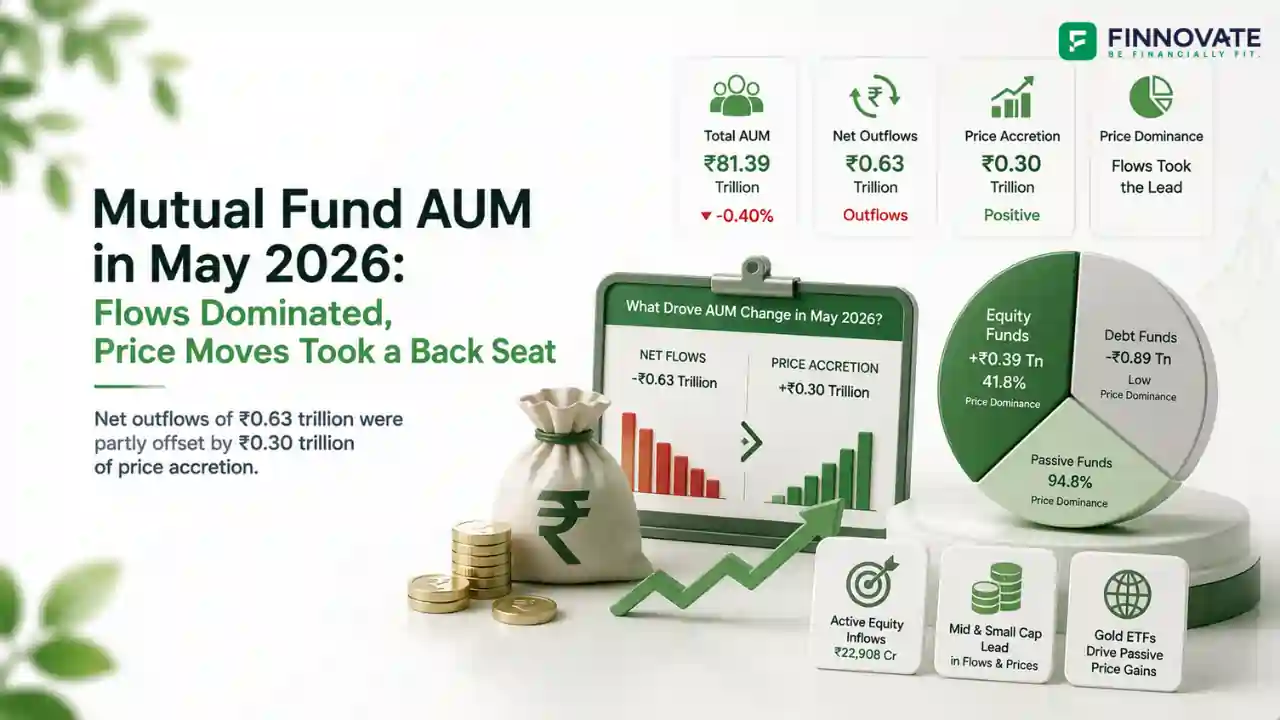
Active equity MF inflows fell 40.4% in May 2026 to ₹22,908 crore, but still drove more A...

Passive fund net inflows hit just ₹362 crore in May 2026 despite 33% folio and 25% AUM g...
Popular now
Learn how to easily download your NSDL CAS Statement in PDF format with our step-by-step g...
Learn what SIF investment means in India, SEBI rules, Rs 10 lakh minimum investment, avail...
Looking for the best financial freedom books? Here’s a handpicked 2026 reading list with...
Clear guide to mutual fund taxation in India for FY 2025–26 after July 2024 changes: equ...