

Why India Is Buying More Oil on the Spot Market After the 2026 Middle East Crisis
India's crude imports shifted fast after the 2026 Iran war. Russia's share hit 52-54% by J...
09 July 2026
Last reviewed: May 2026
India's share of global market capitalisation has fallen to approximately 3%, a level last seen before 2023. The total market cap of BSE-listed companies stands at approximately $4.88 trillion, against a global equity market cap of approximately $158-161 trillion depending on the date and methodology used.
That approximately 3% share compares with a peak of approximately 4.5% to 4.6% reached in mid-to-late 2024, before the sustained FPI selling cycle began. India has given back most of the market cap share gains accumulated between 2020 and 2024, a period when India's share nearly doubled from approximately 2.3% to its peak.
Three factors combined to drive this decline: persistent FPI selling since October 2024, the global rotation toward AI-infrastructure-linked markets where India has no meaningful presence, and valuations that were stretched relative to earnings delivery. Understanding each factor separately helps clarify what would need to change for India's market cap share to recover.
| Market | Market Cap (USD, approx.) | Direction vs End-2024 | Key Driver |
|---|---|---|---|
| United States | ~$68-70 trillion | Rising | AI infrastructure, mega-cap tech |
| China | ~$15 trillion | Rising | AI application sector recovery, stimulus |
| Japan | ~$8-9 trillion | Rising | Corporate governance reforms, yen dynamics |
| India | ~$4.88 trillion | Falling | FPI selling, valuation compression, no AI anchor |
| Taiwan | ~$4-5 trillion | Rising sharply | TSMC AI chip demand; semiconductor cycle |
The table above captures the structural shift underway in global equity weights. India and Taiwan have converged in absolute market cap terms, having moved from a position where India had a significant lead. Taiwan's sharp gain is directly attributable to TSMC's critical role in AI chip manufacturing, which has made it a primary destination for global institutional capital in the current cycle.
India's current market cap share of approximately 3% is often framed as a dramatic fall, and it is. But context matters. India's share was approximately 2.3% as recently as October 2021, even when domestic indices were near lifetime highs. The rise to 4.5%+ between 2022 and 2024 was itself unusual, driven by domestic earnings recovery, strong retail and DII flows, and India's relative outperformance when global markets were correcting.
The current level is roughly in line with India's long-term average of approximately 2.99% since 2018, according to Business Standard citing Bloomberg data. The question is not simply why India has fallen, but why the elevated 4%+ share was not sustained.
What this means: The 4%+ market cap share of 2024 was India's moment of relative global outperformance, not a permanent new baseline. The current approximately 3% level reflects a return toward India's historical weight, amplified by peer market gains that India did not participate in.
The sharp fall from the 2024 peak reflects a dollar-terms erosion in India's market cap of over $1 trillion, combined with other markets gaining substantially. It is the combination of both movements that makes the percentage decline look steep even if India's absolute market cap in rupee terms has not fallen as dramatically.
Since October 2024, FPIs have been net sellers in Indian equities for six consecutive quarters, with cumulative net selling of approximately $52 billion.
The market cap share impact is more than the FPI selling figure alone. The money that left India went somewhere. A large portion was redeployed into other Asian markets, particularly Taiwan, South Korea, and China. That redeployment triggered rallies in those markets, which increased their market cap and their share of the global total.
India's market cap fell as FPIs sold. Peer market caps rose as that money was redeployed. Both movements worked against India's relative share simultaneously. If the FPI money had moved to cash or US Treasuries instead of Asian peers, India's share would still have fallen, but the denominator effect from peer gains would have been absent. The active redeployment into AI-adjacent Asian markets amplified India's relative share decline materially.
FPI allocation decisions at the Asia level are not random. The rotation out of India and into Taiwan, South Korea, and China has a specific thesis: artificial intelligence infrastructure.
Taiwan's TSMC is the world's leading dedicated semiconductor foundry and a major manufacturer for global high-performance computing and AI chip demand. Its role in advanced chip manufacturing has made Taiwan a direct and primary beneficiary of the AI infrastructure investment cycle.
South Korea benefits from global memory and semiconductor demand through Samsung Electronics and SK Hynix, particularly as AI servers require advanced memory products. Both countries have anchor companies that give global investors a clear, large-scale way to invest in the AI hardware theme.
Several Chinese technology companies also attracted institutional buying on the thesis that AI application development in China would follow a separate and large technology path. The directional shift is clear: Taiwan's market cap has risen sharply on the strength of TSMC's AI chip demand, narrowing the gap with India's absolute market cap significantly.
India has no equivalent play in the AI infrastructure space. The top 10 most valuable companies globally are dominated by technology and AI-infrastructure names. India has no company in this category.
More specifically, India's largest institutional-weight sector, IT services, faces the opposite risk: the possibility that AI could automate significant portions of their revenue base. From a market-flow lens, India's IT services sector faced persistent selling pressure at the same time that AI hardware and semiconductor-linked markets attracted large global institutional inflows.
India's market cap share rose sharply between 2022 and 2024 partly because Indian markets outperformed global peers. That outperformance came at a valuation cost: by 2024, Indian large-caps were trading at significant premiums to global and emerging market peers.
Those premium valuations rested on two assumptions: high nominal GDP growth and correspondingly high corporate earnings growth. When nominal GDP growth moderated in 2025, corporate earnings followed. Profit and sales growth across multiple sectors, including banking, FMCG, and consumption-linked businesses, came in below earlier expectations for several consecutive quarters.
The valuation compression that followed was not driven by any single shock. It was the gradual unwinding of a growth premium that was priced in but not delivered. The Trump tariffs and Middle East geopolitical situation added external pressure but were not the primary cause. They acted as accelerants on a correction that was already underway for valuation reasons.
Three conditions would need to converge for India's global market cap share to return to and sustain the 4%+ range.
The market cap expansion of 2022 to 2024 was justified by earnings expectations that have not fully materialised. A genuine recovery in corporate earnings growth across the large-cap universe, particularly in banking, IT, and consumption sectors, would re-establish the foundation for valuation expansion. Improving corporate earnings visibility is the most direct catalyst for this reversal. Past forecasts are not indicative of future outcomes.
India's market cap share cannot recover meaningfully without FPI participation. FPI sentiment has been fickle historically. In 2009 and 2013, FPIs sold heavily before returning in significant size. The conditions for FPI return include rupee stability, earnings visibility, and some reduction in the current global AI-driven reallocation theme. None of these are imminent, but none are structurally unavailable either.
This is the hardest condition to forecast. India does not currently have an AI infrastructure anchor company that global investors can use as a direct proxy for the AI theme.
The AI services and applications layer is an area where India's software engineering talent and enterprise IT relationships could create value at scale. If Indian companies demonstrate the ability to build or enable AI-layer services in ways that generate significant revenue, the FPI narrative around India's technology sector could shift. This is a medium-term thesis, not a current quarter one.
The market cap share data is a global institutional signal, not a direct portfolio instruction. Three observations are relevant for Indian investors thinking about their own allocation.
India's domestic market has seen DII and SIP flows offsetting FPI selling and keeping markets from falling further. But global capital has been flowing elsewhere, and those flows have driven exceptional returns in Taiwan, South Korea, the US, and China. An India-only portfolio missed these gains.
Whether some international diversification is appropriate for a specific investor depends on their goals, time horizon, and existing allocation. Please consult a SEBI-registered investment adviser before making any changes to portfolio allocation.
India's growth story is real and its demographic fundamentals are intact. But buying into any market at peak valuation levels, including India in 2024, creates return headwinds even when the underlying economy performs. The market cap share decline is partly the mathematical consequence of 2024 premium valuations meeting a slower earnings growth reality in 2025. This applies to any market, not only India.
Indian retail investors and DIIs have absorbed approximately $52 billion of cumulative FPI selling without the catastrophic index falls seen in 2008 or 2013. That structural deepening of domestic capital markets is itself a significant development. India's market no longer requires FPI validation to function. Whether that resilience persists through a longer or deeper FPI selling cycle is an open question, but the current evidence is encouraging.
The FPI selling cycle and global capital rotation have implications for how India-focused equity portfolios have performed relative to global benchmarks. Whether your allocation reflects your actual goals and risk tolerance is worth a 30-minute review.
Book a free callIndia's share of global market cap is the total dollar value of all BSE-listed companies as a percentage of the total dollar value of all equity markets globally. When India's share is approximately 3%, it means India's stock market represents around 3 cents of every dollar of global equity value. A rising share signals growing institutional weight in global capital allocation; a falling share signals capital reallocation away from India toward other markets.
Three factors combined: FPI net selling of approximately $52 billion since October 2024, which reduced the dollar value of Indian equities; parallel gains in AI-linked markets in Taiwan, South Korea, and China, which increased those markets' share of the global total; and valuation compression as corporate earnings growth came in below the premium levels priced into Indian large-caps in 2024.
A recovery toward the 4%+ range would require corporate earnings delivery, FPI return flows at scale, and the emergence of a credible AI-layer investment narrative for India. Past patterns in 2009 and 2013 show FPI sentiment can shift materially. Past market behaviour is not indicative of future outcomes. Please consult a SEBI-registered investment adviser before making any portfolio decisions based on macro signals.
The market cap share metric is a global institutional signal rather than a direct indicator of Indian economic health. India's GDP growth remains among the fastest of large economies. The DII and SIP-driven resilience of domestic markets is a structural positive. The market cap share decline reflects capital allocation choices by global institutions, not a fundamental impairment of India's economic position. Please consult a SEBI-registered investment adviser for guidance on portfolio positioning.
Taiwan and South Korea host the world's most important AI hardware companies. TSMC in Taiwan is the world's leading dedicated semiconductor foundry and a major manufacturer for global high-performance computing and AI chip demand. South Korea benefits from global memory and semiconductor demand through Samsung Electronics and SK Hynix, particularly as AI servers require advanced memory products. India has no comparable AI hardware anchor company, and its IT sector faced the opposite pressure: the risk that AI would disrupt IT services revenues.
Historically, FPIs have returned to India after periods of sustained selling when earnings visibility improved, the rupee stabilised, and valuations compressed to attractive levels relative to growth. All three conditions are partially forming. Earnings are expected to recover in FY27. Rupee pressure has moderated. Valuations have come down significantly from the 2024 peak. Past FPI flow patterns are not indicative of future flows. Please consult a SEBI-registered investment adviser for guidance.
Disclaimer: This article is for general information and educational purposes only. It does not constitute investment advice, a recommendation, or an offer to buy or sell any securities or financial instruments. Market cap data sourced from publicly available market data. FPI flow data from NSDL. All figures are approximate and subject to change with daily market movements. Past market behaviour and capital flow patterns are not indicative of future outcomes. No investment decision should be made based solely on the contents of this article. Please consult a SEBI-registered investment adviser or qualified financial professional before making any investment decision. Equity investments are subject to market risks.
No spam. Only new posts, simple explainers, and practical money checklists for busy professionals.
Finnovate is a SEBI-registered financial planning firm that helps professionals bring structure and purpose to their money. Over 3,500+ families have trusted our disciplined process to plan their goals - safely, surely, and swiftly.
Our team constantly tracks market trends, policy changes, and investment opportunities like the ones featured in this Weekly Capsule - to help you make informed, confident financial decisions.
Learn more about our approach and how we work with you:


No spam. Only new posts, simple explainers, and practical money checklists.
You may also like
India's crude imports shifted fast after the 2026 Iran war. Russia's share hit 52-54% by J...
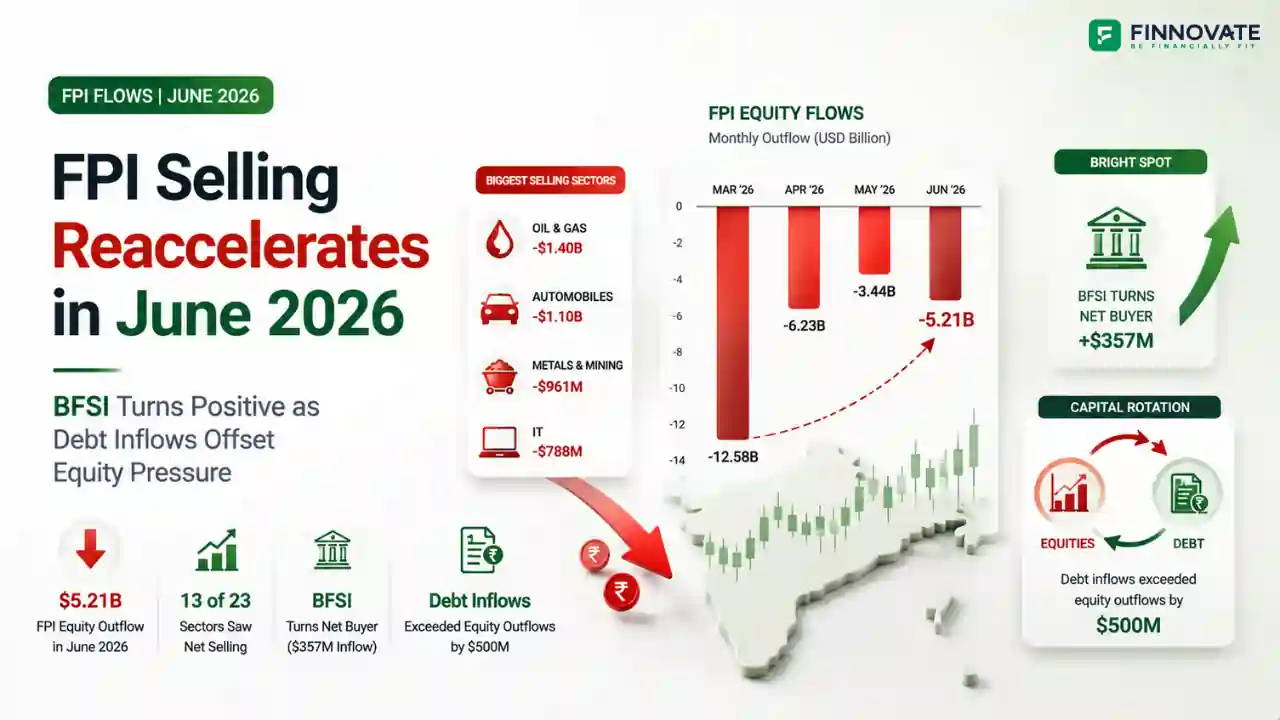
FPIs sold $5.21 billion from Indian equities in June 2026. But BFSI turned net buyer at $3...

Amazon Now is targeting 100 Indian cities with 1,000+ micro-fulfilment centres. But the re...

RBI replaced its NBFC-UL scoring system with a single ₹1 lakh crore asset test on June 2...
Popular now
Learn how to easily download your NSDL CAS Statement in PDF format with our step-by-step g...
Learn what SIF investment means in India, SEBI rules, Rs 10 lakh minimum investment, avail...
Looking for the best financial freedom books? Here’s a handpicked 2026 reading list with...
Clear guide to mutual fund taxation in India for FY 2025–26 after July 2024 changes: equ...