

Oil Above $100: Rupee, RBI and What India Can Absorb
Brent crossed $100 on July 24, 2026. The rupee hit ₹96.80. India has $675bn in reserves ...
24 July 2026

After strong inflows of $1.65 billion in October, the first half of November 2025 swung sharply into negative territory. FPIs pulled out $685 million from Indian equities in just 15 days.
But here’s the twist - the number could have been much worse. The only reason the headline figure didn’t plunge deeper was because FPIs pumped $885 million into IPOs. Without these primary market inflows, India would have reported a massive $(1,570) million sell-off in the secondary market alone.
In short, IPOs saved the month.
The first fortnight of November saw several large and high-demand IPOs including Orkla India, Lenskart, Groww, Pine Labs, and PhysicsWallah. FPIs participated heavily, offsetting aggressive selling in listed equities.
Here is how the math played out:
Without the IPO pipeline, India would have reported one of the deepest early-month outflows in several quarters.
The broader foreign holdings picture tells a cautious story:
These numbers remain well below the $1 trillion+ peak of September 2024. FPI ownership of Indian equities is still at multi-year lows, reflecting the ongoing “reallocation” theme.
The two major macro takeaways:
NSDL’s sectoral data for early November shows a clear polarization: a few sectors saw strong buying while many faced deep selling.
| Sector | Equity Flows ($ Million) | Sector | Equity Flows ($ Million) |
|---|---|---|---|
| Telecommunication | 1,061 | Construction Materials | -42 |
| Oil, Gas & Consumable Fuels | 337 | Automobile & Auto Components | -43 |
| Other Sectors | 163 | Chemicals | -58 |
| Capital Goods | 89 | Services | -76 |
| Realty | 27 | Consumer Durables | -155 |
| Diversified | 5 | FMCG | -230 |
| Utilities | 1 | Financial Services (BFSI) | -230 |
| Forest Materials | -1 | Power | -283 |
| Metals & Mining | -12 | Healthcare | -285 |
| Media & Entertainment | -17 | Consumer Services | -329 |
| Textiles | -21 | Information Technology | -549 |
| Construction | -37 | Grand Total | -685 |
Data Source: NSDL

FPIs bought $1,061 million worth of telecom stocks - primarily because the Singtel stake sale was absorbed almost entirely by foreign investors.
At $337 million, this was the second-best sector for inflows. FPIs added to RIL and downstream players amid improving GRMs (gross refining margins).
FPIs sold heavily in services and consumer-facing sectors, but IPO participation in Lenskart and PhysicsWallah softened the overall hit.
With $(549) million of selling, IT was the largest negative sector. Weak global cues and mixed Q2 FY26 numbers led FPIs to continue reducing exposure.
Both sectors saw substantial selling because the loss of GST input tax credit increased cost pressures.
IT, healthcare, and chemicals continue to face FPI selling due to ongoing tariff risks and global trade uncertainty.
Globally, FPIs remain positioned as “Long Asia – Short India,” awaiting clarity on an Indo–US trade deal.
Disclaimer: This article is for informational and educational purposes only and does not constitute investment advice. Market data and sectoral trends discussed here are meant for awareness only. Please do your own research before making investment decisions.
No spam. Only new posts, simple explainers, and practical money checklists for busy professionals.
Finnovate is a SEBI-registered financial planning firm that helps professionals bring structure and purpose to their money. Over 3,500+ families have trusted our disciplined process to plan their goals - safely, surely, and swiftly.
Our team constantly tracks market trends, policy changes, and investment opportunities like the ones featured in this Weekly Capsule - to help you make informed, confident financial decisions.
Learn more about our approach and how we work with you:
No comments yet. Start the conversation. What would you add?
No spam. Only new posts, simple explainers, and practical money checklists.
You may also like
Brent crossed $100 on July 24, 2026. The rupee hit ₹96.80. India has $675bn in reserves ...
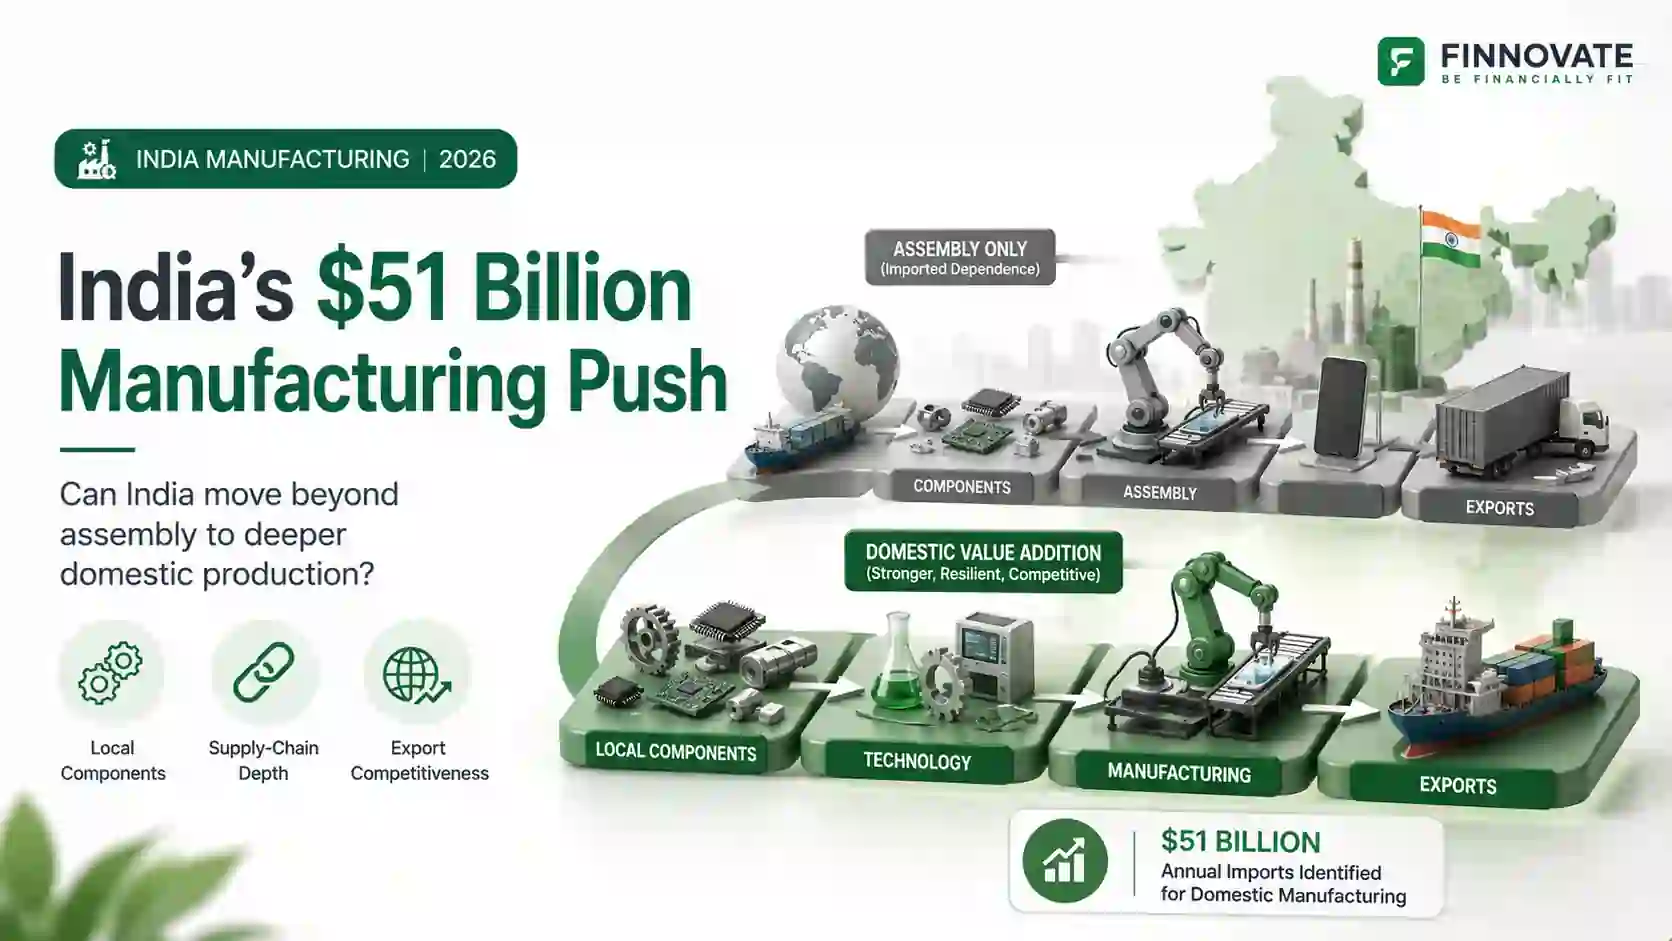
India has identified $51 billion of imports across 100 products for domestic manufacturing...

Over $300 billion in global drug revenue loses exclusivity by 2030. India's generic base i...
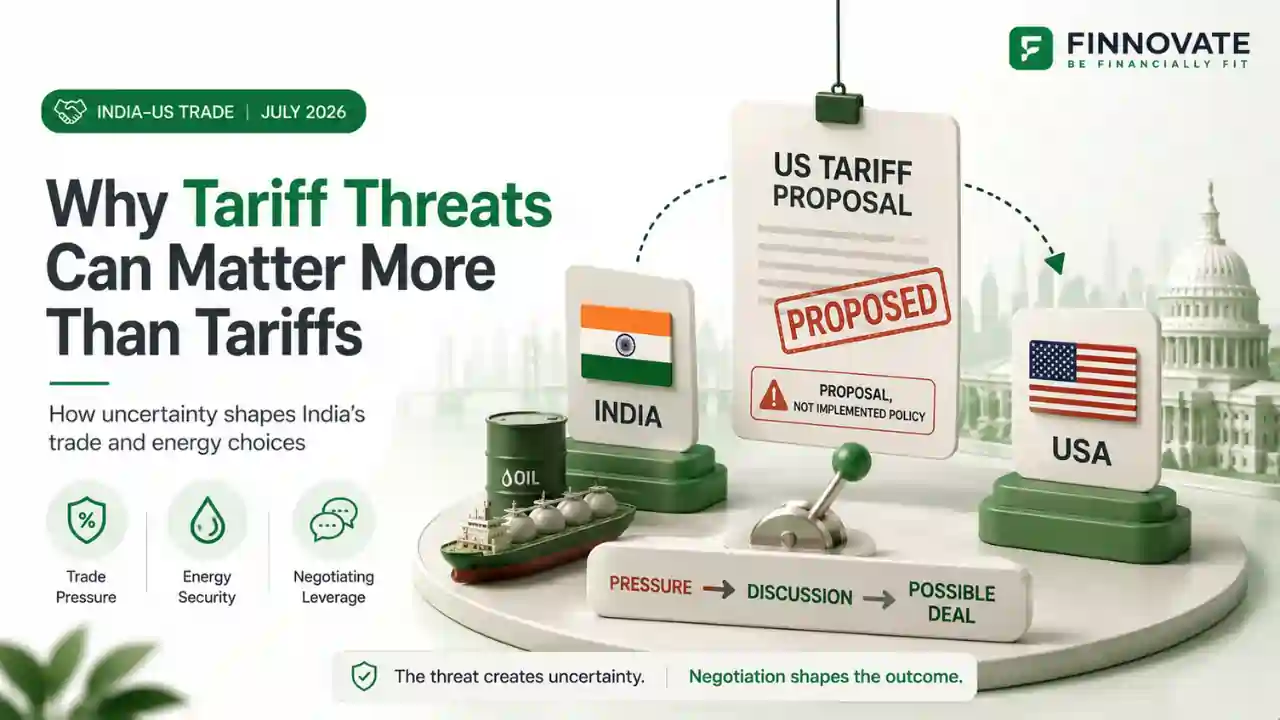
The US proposes 100% tariffs on India for buying Russian oil, down from an earlier 500%. N...
Popular now

Learn how to easily download your NSDL CAS Statement in PDF format with our step-by-step g...

Learn what SIF investment means in India, SEBI rules, Rs 10 lakh minimum investment, avail...

Looking for the best financial freedom books? Here’s a handpicked 2026 reading list with...

Clear guide to mutual fund taxation in India for FY 2025–26 after July 2024 changes: equ...