

Which Equity Fund Categories Grew the Fastest Over 3 Years?
Equity fund folios grew 22.96% CAGR and AUM 29.69% over 3 years. See which of the 11 categ...
08 July 2026
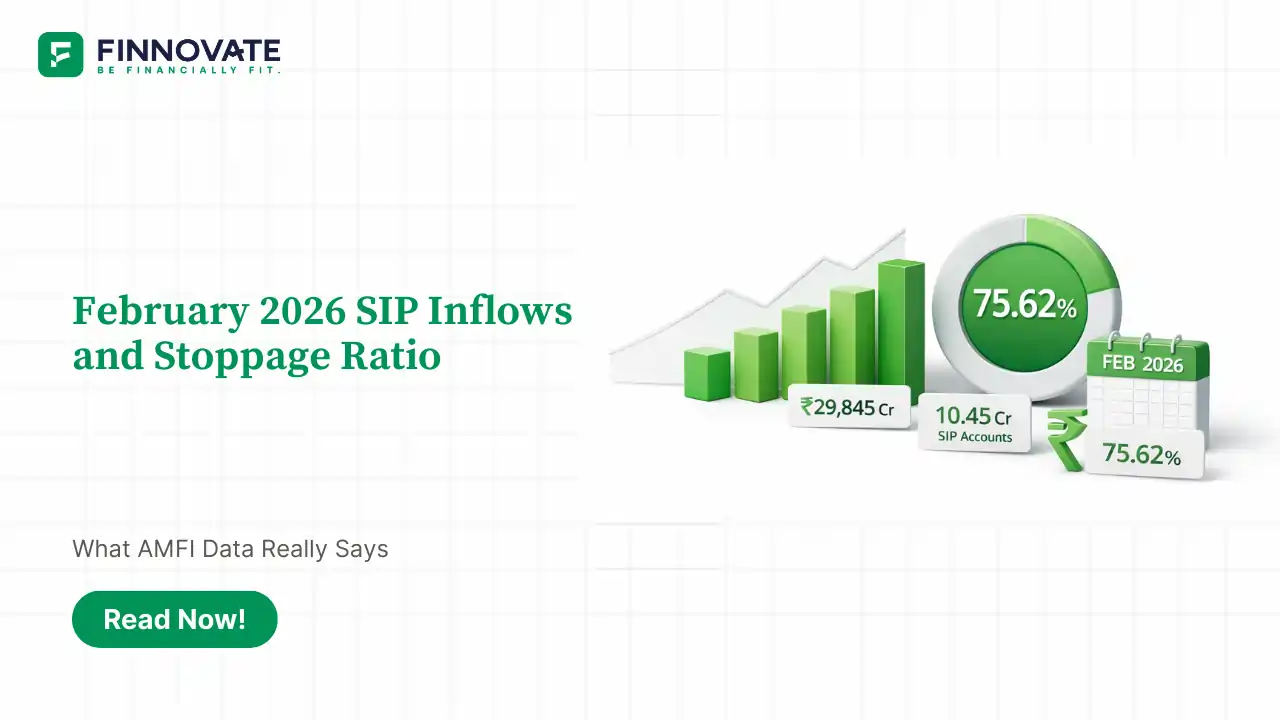
SIP inflows came in at ₹29,845 crore in February 2026, down from ₹31,002 crore in January. At the same time, the SIP stoppage ratio moved up to about 75.62%. On the surface, that may look like a weak month for systematic investing.
But that is not the full picture.
The same set of numbers also shows that SIP accounts rose to 10.45 crore and SIP assets under management reached ₹16.64 lakh crore. So while February was softer on monthly inflows, the broader SIP base still kept expanding.
| Metric | February 2026 |
|---|---|
| SIP Inflows | ₹29,845 crore |
| SIP Stoppage Ratio | 75.62% |
| New SIP Registrations | 65.72 lakh |
| SIPs Discontinued / Tenure-Completed | 49.70 lakh |
| SIP Accounts | 10.45 crore |
| SIP AUM | ₹16.64 lakh crore |
These numbers matter because they point in two directions at once. Monthly inflows were lower than January, but the overall SIP structure still moved higher. That is why February 2026 SIP inflows and stoppage ratio should not be read through only one headline number.
The biggest visible change was the dip in monthly SIP inflows from ₹31,002 crore in January to ₹29,845 crore in February. This brought SIP inflows back below the ₹30,000 crore mark.
At the same time, the total SIP account base rose from 10.29 crore to 10.45 crore. SIP AUM also moved up to ₹16.64 lakh crore. In simple words, monthly collections cooled, but the larger SIP structure still kept growing.
That distinction matters. A softer month is not automatically the same thing as a structural slowdown.
One practical reason is the calendar. February is a shorter month, and that can affect how many SIP instalments get processed within the month. Many SIPs are linked to fixed dates. In a shorter month, timing differences can influence the monthly collection number.
This does not mean the full dip should be explained away only by the calendar. But it does mean the February number should be read with some caution. Monthly SIP data can sometimes look weaker or stronger because of timing effects, and that is why one month alone rarely gives the full picture.
If you want to understand how regular monthly investing builds over time, a SIP calculator can help connect monthly contributions with longer-term outcomes.
The SIP stoppage ratio compares the number of SIPs that were discontinued or completed during a month with the number of new SIPs registered in the same month.
In February 2026, 49.70 lakh SIPs were discontinued or tenure-completed, while 65.72 lakh new SIPs were registered. That pushed the ratio to about 75.62%, slightly above January’s 74.83%.
SIP stoppage ratio is an important metric, but it should not be read in a dramatic way. A high ratio does not automatically mean investors are exiting in panic. The number also includes SIPs that have simply completed their chosen tenure. So it is better seen as a measure of churn, not as a direct measure of fear.
That is the key point. When people ask what the February 2026 SIP inflows and stoppage ratio really says, the answer is not that investors have suddenly turned away from SIPs. The more accurate answer is that churn remains elevated, even as new registrations and overall participation continue.
The strongest balancing factor in the February data is that SIP accounts still rose to 10.45 crore and SIP AUM still rose to ₹16.64 lakh crore. If systematic investing discipline had weakened in a broad way, this part of the data would likely have looked weaker too.
Instead, the structure still appears to be expanding. That is why the February numbers are better described as a month of moderation rather than a month of breakdown.
Inflows were softer. Yes. Stoppage ratio stayed high. Yes. But the overall base of SIP participation did not shrink.
For readers tracking actual portfolio return experience over time rather than just one month’s flow data, the XIRR calculator can help measure returns across real cash flows.

The February numbers point to three clear conclusions.
Put together, the cleanest reading is simple: February looked like a pause, not a collapse. The data does not support a panic interpretation, but it does support tracking future months closely to see whether this softness repeats.
This is also where the investing journey matters. SIPs are about accumulation. Later, the conversation shifts to withdrawals and sustainability. If you want to understand that second part, the SWP calculator helps connect accumulated capital with future cash flow.
For readers thinking beyond one month and toward long-term financial independence, the FIRE calculator can help connect regular investing with larger life goals.
SIP inflows in February 2026 stood at ₹29,845 crore. In January 2026, the number was ₹31,002 crore.
The SIP stoppage ratio in February 2026 was about 75.62%, compared with 74.83% in January.
A shorter month likely played a role, which can affect the number of SIP instalments processed within the month.
Not necessarily. The ratio also includes SIPs that completed their tenure, so it reflects churn, not only investor exits.
Yes. SIP accounts rose to 10.45 crore in February from 10.29 crore in January.
SIP AUM stood at ₹16.64 lakh crore in February 2026.
Disclaimer: This article is for educational and informational purposes only. It is not investment advice or a recommendation to start, stop, or change any SIP, mutual fund, or financial strategy.
No spam. Only new posts, simple explainers, and practical money checklists for busy professionals.
Finnovate is a SEBI-registered financial planning firm that helps professionals bring structure and purpose to their money. Over 3,500+ families have trusted our disciplined process to plan their goals - safely, surely, and swiftly.
Our team constantly tracks market trends, policy changes, and investment opportunities like the ones featured in this Weekly Capsule - to help you make informed, confident financial decisions.
Learn more about our approach and how we work with you:


No spam. Only new posts, simple explainers, and practical money checklists.
You may also like
Equity fund folios grew 22.96% CAGR and AUM 29.69% over 3 years. See which of the 11 categ...

Active equity MF inflows fell 40.4% in May 2026 to ₹22,908 crore, but still drove more A...

Passive fund net inflows hit just ₹362 crore in May 2026 despite 33% folio and 25% AUM g...
Popular now
Learn how to easily download your NSDL CAS Statement in PDF format with our step-by-step g...
Learn what SIF investment means in India, SEBI rules, Rs 10 lakh minimum investment, avail...
Looking for the best financial freedom books? Here’s a handpicked 2026 reading list with...
Clear guide to mutual fund taxation in India for FY 2025–26 after July 2024 changes: equ...