
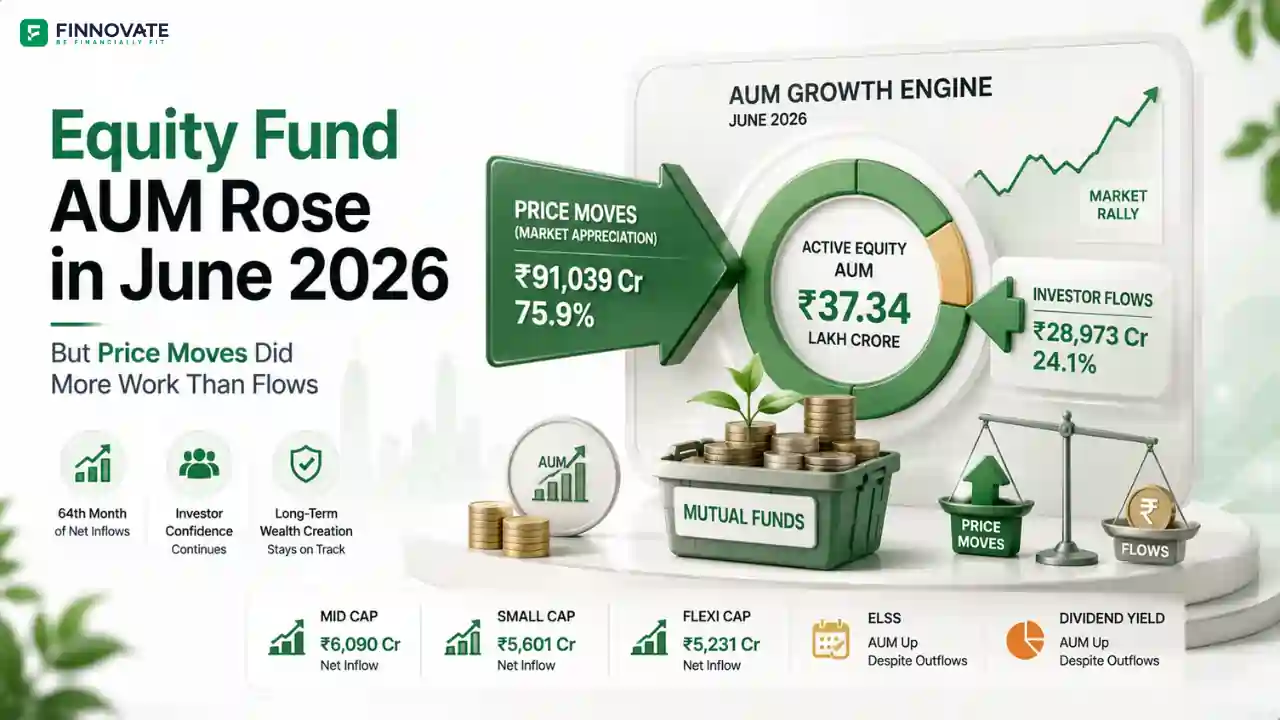
Equity Fund AUM June 2026: Price Moves Did More Work Than Flows
Active equity fund AUM rose 3.3% to ₹37.34 lakh crore in June 2026. Price accretion of �...
15 July 2026

In May 2025, the Indian equity mutual fund market witnessed a strong surge in Assets Under Management (AUM), but this growth was led more by market performance than by investor inflows.
Out of ₹1.49 lakh crore total AUM growth, ₹1.29 lakh crore (87%) came purely from price appreciation, not fresh investments. This indicates that while investors stayed cautious, the bull market did the heavy lifting.
Let’s break down what this shift means for your investments and where smart money is going.
Price accretion refers to the rise in the value of the fund’s holdings due to market gains. It is different from net inflows, which are actual new investments made by people like you and me.
In a rising market:
| Category | Net Inflow (₹ Cr) | AUM Closing (₹ Cr) | Total AUM Accretion (₹ Cr) | Price Accretion (₹ Cr) | % via Price Accretion |
|---|---|---|---|---|---|
| ELSS | -678.11 | 2,46,293.05 | 7,242.43 | 7,920.54 | 109.36% |
| Dividend Yield | -20.82 | 32,177.14 | 844.23 | 865.05 | 102.47% |
| Value/Contra | -92.28 | 1,96,339.39 | 5,482.79 | 5,575.07 | 101.68% |
| Sectoral/Thematic | 2,052.48 | 4,92,403.81 | 22,064.76 | 20,012.28 | 90.70% |
| Small Cap | 3,214.21 | 3,36,005.21 | 28,837.10 | 25,622.89 | 88.85% |
| Mid Cap | 2,808.68 | 4,08,092.68 | 25,008.97 | 22,200.29 | 88.77% |
| Large Cap | 1,250.47 | 3,83,666.59 | 9,146.88 | 7,896.40 | 86.33% |
| Focused | 947.18 | 1,55,870.44 | 5,647.39 | 4,700.21 | 83.23% |
| Large & Mid Cap | 2,690.69 | 2,87,392.50 | 14,134.08 | 11,443.39 | 80.96% |
| Flexi Cap | 3,841.32 | 4,71,974.48 | 17,306.57 | 13,465.25 | 77.80% |
| Multi Cap | 2,999.29 | 1,95,159.76 | 12,026.95 | 9,027.67 | 75.06% |
| Active Equity Funds | 19,013.12 | 32,05,375.05 | 1,47,742.16 | 1,28,729.04 | 87.13% |
> Source: AMFI India
Funds like ELSS, Dividend Yield, and Value Funds
Takeaway: Don’t be misled by high AUM growth here - it wasn’t driven by popularity or conviction.
Funds like Sectoral, Small Cap, Mid Cap
Takeaway: Alpha-hunting is slowing; investors are getting conservative.
Funds like Flexi Cap, Large & Mid Cap, Multi Cap
Takeaway: The smart money is shifting from aggressive bets to balanced diversification.
| Date | Update |
|---|---|
| Jun 13, 2025 | AMFI reports ₹34,697 Cr total equity inflow; 3rd highest in FY25 |
| Jun 10, 2025 | Mid Cap and Small Cap funds hit record NAVs, volatility returns |
| May 31, 2025 | ELSS redemptions continue amid tax regime confusion |
| May 15, 2025 | Flexi Cap funds report 22% rise in SIP contribution YoY |
| Situation | Suggested Action |
|---|---|
| Already invested in small/mid cap funds | Review exposure; consider rebalancing |
| Looking for long-term, stable growth | Explore Flexi Cap or Multi Cap categories |
| Tax planning with ELSS | Reconsider only if you're under old regime |
| Want to avoid timing markets | Stick to disciplined SIPs in diversified funds |
Whether you're confused about ELSS, Multi-Cap, or just want a second opinion - we’re here to simplify things. Book a free consultation and get your investments aligned with your goals.
Book Your Free Call NowDisclaimer: The content in this article is for educational purposes only and should not be considered financial advice. Please consult a qualified advisor before making investment decisions.
No spam. Only new posts, simple explainers, and practical money checklists for busy professionals.
Finnovate is a SEBI-registered financial planning firm that helps professionals bring structure and purpose to their money. Over 3,500+ families have trusted our disciplined process to plan their goals - safely, surely, and swiftly.
Our team constantly tracks market trends, policy changes, and investment opportunities like the ones featured in this Weekly Capsule - to help you make informed, confident financial decisions.
Learn more about our approach and how we work with you:
No comments yet. Start the conversation. What would you add?
No spam. Only new posts, simple explainers, and practical money checklists.
You may also like
Active equity fund AUM rose 3.3% to ₹37.34 lakh crore in June 2026. Price accretion of �...
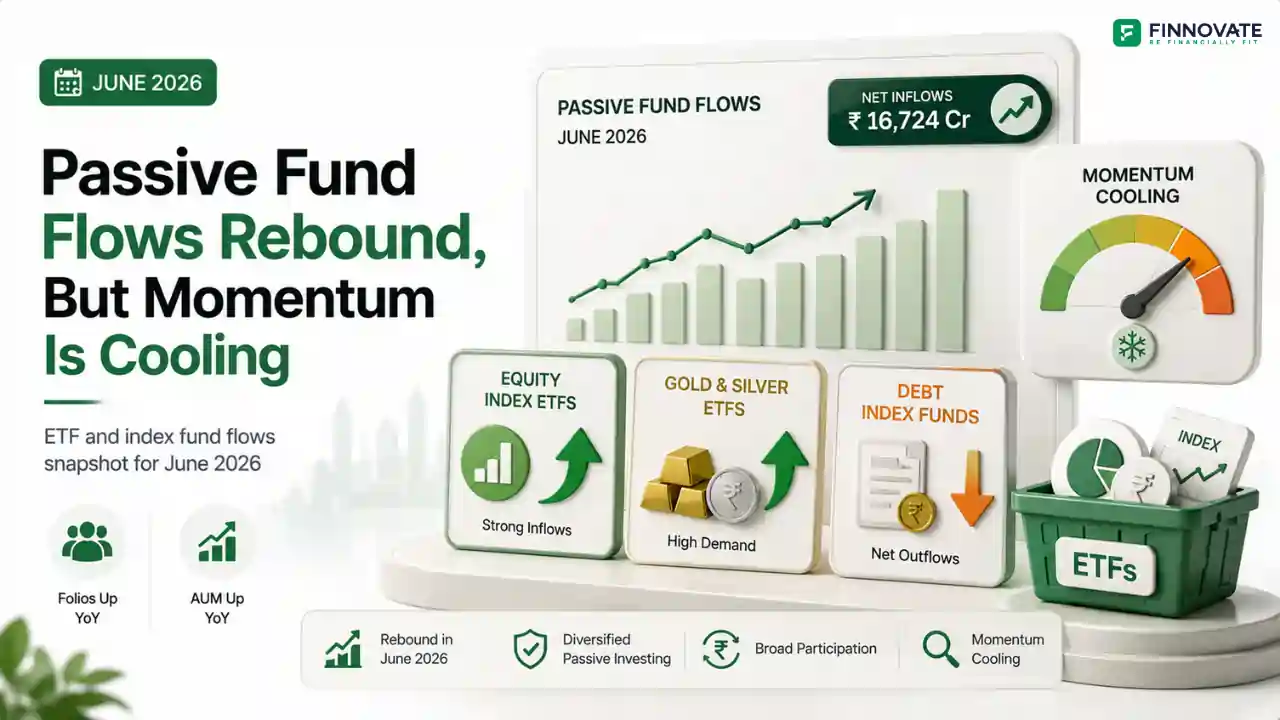
Passive fund inflows rebounded to ₹16,724 crore in June 2026, with gold and silver ETFs ...

Equity fund folios grew 22.96% CAGR and AUM 29.69% over 3 years. See which of the 11 categ...

Active equity MF inflows fell 40.4% in May 2026 to ₹22,908 crore, but still drove more A...
Popular now

Learn how to easily download your NSDL CAS Statement in PDF format with our step-by-step g...

Learn what SIF investment means in India, SEBI rules, Rs 10 lakh minimum investment, avail...

Looking for the best financial freedom books? Here’s a handpicked 2026 reading list with...

Clear guide to mutual fund taxation in India for FY 2025–26 after July 2024 changes: equ...