

Oil Above $100: Rupee, RBI and What India Can Absorb
Brent crossed $100 on July 24, 2026. The rupee hit ₹96.80. India has $675bn in reserves ...
24 July 2026

If you only look at the headline number, India’s trade deficit for FY26 so far looks… fine. Up to November 2025, the overall trade deficit is just 2.33% higher than last year for the same period.
But that comfort can be misleading. Last year, the deficit was meaningfully trimmed in the final months. This year, tariff pressure is only beginning to show from October. If an India–US trade deal doesn’t happen quickly, the next few months could look very different.
And that’s where the worry begins: the Current Account Deficit (CAD) may look under control in H1, but H2 could test it.
For the first 8 months of FY26 (April to November 2025), India’s overall trade activity is strong. Total trade volume has already touched $1.21 trillion. If this pace holds, total trade could cross $1.80 trillion by March 2026.
But the real story is not total trade volume. It’s what’s happening inside it: goods are under pressure, services are cushioning, and tariffs may widen the gap further in H2.
| Macro Variable (Year-to-Date) | FY26 (Apr–Nov) | FY26 (Apr–Oct) | FY25 (Apr–Nov) | Change YoY (%) |
|---|---|---|---|---|
| Merchandise Exports | 292.07 | 254.25 | 284.60 | 2.62% |
| Merchandise Imports | 515.21 | 451.08 | 487.93 | 5.59% |
| Total Merchandise Trade | 807.28 | 705.33 | 772.53 | 4.50% |
| Merchandise Trade Deficit | -223.14 | -196.83 | -203.33 | 9.74% |
| Services Exports | 270.06 | 237.55 | 248.56 | 8.65% |
| Services Imports | 135.93 | 118.87 | 132.21 | 2.81% |
| Total Services Trade | 405.99 | 356.42 | 380.77 | 6.62% |
| Services Trade Surplus | 134.13 | 118.68 | 116.35 | 15.28% |
| Combined Exports | 562.13 | 491.80 | 533.16 | 5.43% |
| Combined Imports | 651.14 | 569.95 | 620.14 | 5.00% |
| Overall Trade Volume | 1,213.27 | 1,061.75 | 1,153.30 | 5.20% |
| Overall Trade Deficit | -89.01 | -78.15 | -86.98 | 2.33% |
So yes, the overall deficit looks stable. But the goods deficit is expanding faster, and services must keep offsetting it.
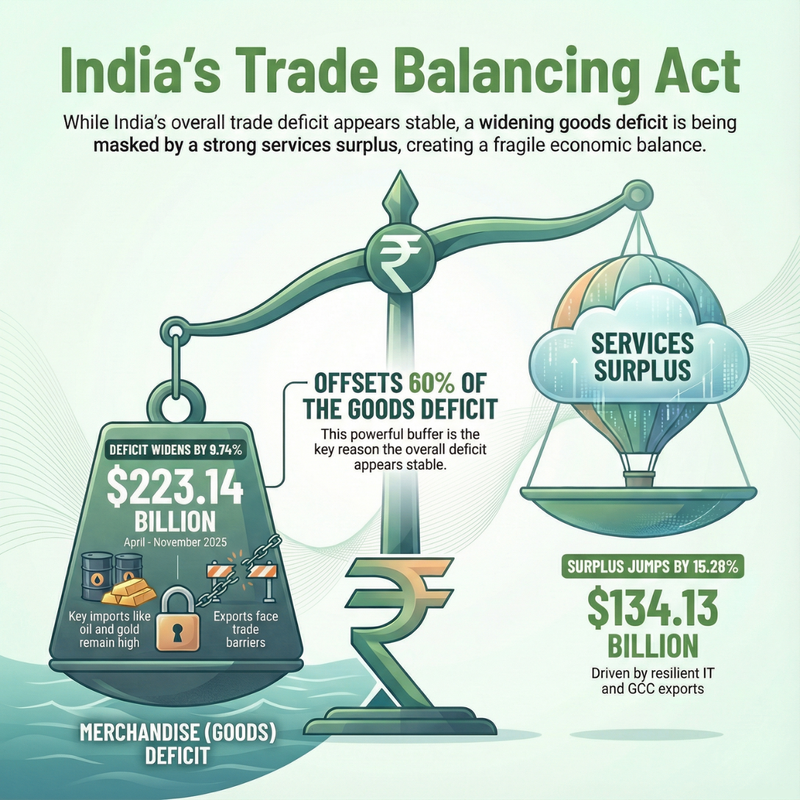
For FY26 (Apr–Nov), the merchandise trade deficit stands at $223.14 billion, which is 9.74% higher year-on-year. This matters because goods deficit is where India’s external balance usually feels stress first.
Two things make this tough to fix quickly:
So even if exports hold up modestly, imports can keep the deficit wide. That’s the setup that can hurt CAD later.
The good news is services trade is doing its job. As of November 2025, the services trade surplus is $134.13 billion, up 15.28% year-on-year.
Unlike goods, services exports have stayed resilient. IT exports and GCC (Global Capability Centre) revenues have grown during this period. In other words, tariffs may be hitting goods, but services are still bringing in dollars.
This services engine is the reason the overall trade deficit hasn’t blown out yet.
Think of the services surplus as a buffer that absorbs part of the merchandise deficit.
In FY26 so far, the offset ratio (services surplus as a share of the goods deficit) is 60.1%, up from 57.2% last year. That’s an improvement.
Another positive sign: the service export ratio is higher this year at 92.5%, compared to 87.3% in FY25.
But here’s the catch: even a strong services surplus can struggle if the merchandise deficit widens sharply in H2.
The overall trade deficit for Apr–Nov is $89.01 billion versus $86.98 billion last year. Just a small change, and that’s why the headline looks calm.
But the timing matters. The full impact of tariffs started showing only from October 2025. If the India–US trade deal remains elusive, the pressure can increase in the remaining months of FY26.
And remember: last year’s deficit was compressed in the later months. If that doesn’t happen this year, the year-end numbers could surprise.
The Current Account Deficit (CAD) is the broader measure of India’s external gap. It becomes a concern when the country’s outflows (imports and payments) consistently exceed inflows (exports and receipts).
For FY26, the H1 CAD picture looks manageable. The risk builds if one or both of these happen in H2:
If that gap widens meaningfully in the second half, CAD could move from “under control” to “something to watch closely.”

Disclaimer: This article is for informational and educational purposes only and does not constitute investment or policy advice.
No spam. Only new posts, simple explainers, and practical money checklists for busy professionals.
Finnovate is a SEBI-registered financial planning firm that helps professionals bring structure and purpose to their money. Over 3,500+ families have trusted our disciplined process to plan their goals - safely, surely, and swiftly.
Our team constantly tracks market trends, policy changes, and investment opportunities like the ones featured in this Weekly Capsule - to help you make informed, confident financial decisions.
Learn more about our approach and how we work with you:
No comments yet. Start the conversation. What would you add?
No spam. Only new posts, simple explainers, and practical money checklists.
You may also like
Brent crossed $100 on July 24, 2026. The rupee hit ₹96.80. India has $675bn in reserves ...

India has identified $51 billion of imports across 100 products for domestic manufacturing...

Over $300 billion in global drug revenue loses exclusivity by 2030. India's generic base i...

The US proposes 100% tariffs on India for buying Russian oil, down from an earlier 500%. N...
Popular now

Learn how to easily download your NSDL CAS Statement in PDF format with our step-by-step g...

Learn what SIF investment means in India, SEBI rules, Rs 10 lakh minimum investment, avail...

Looking for the best financial freedom books? Here’s a handpicked 2026 reading list with...

Clear guide to mutual fund taxation in India for FY 2025–26 after July 2024 changes: equ...