

NSE IPO 2026: DRHP Filed - Valuation, Risks and What Investors Should Know
NSE filed its DRHP on June 17, 2026. Expected IPO size ₹30,000 crore, 100% OFS, valuatio...
22 June 2026
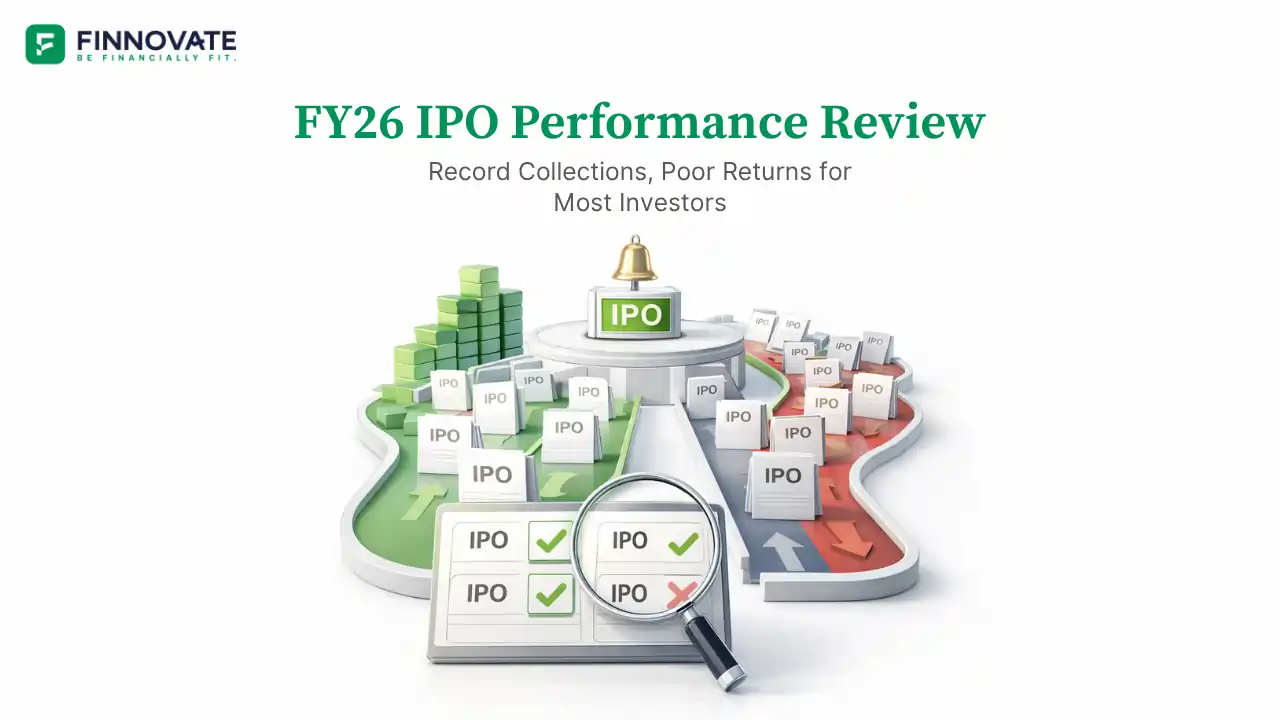
71 out of 108 mainboard IPOs in FY26 are currently trading below their issue price.
That single number tells the real story of India's primary market this year. FY26 raised approximately ₹1,75,186 crore across 108 mainboard IPOs, a record for Indian IPO fundraising. The market was willing to absorb record capital from issuers. It was far less willing to reward investors who subscribed to most of it.
This article breaks down what actually happened across FY26 IPOs, what the data says about subscription versus returns, and what the year's patterns mean for investors going forward.
The table below captures the 20 largest mainboard IPOs of FY26 by issue amount, along with subscription ratio, issue price, current market price, and absolute returns.
| IPO Issuing Company | Issue Amount (₹ Cr) | Subscription (X) | Issue Price (₹) | Market Price (₹) | Absolute Returns |
|---|---|---|---|---|---|
| Tata Capital | 15,511.87 | 1.65 | 326 | 320.25 | -1.76% |
| HDB Financial Services | 12,500.00 | 13.07 | 740 | 590.10 | -20.26% |
| LG Electronics India | 11,607.01 | 38.03 | 1,140 | 1,536.10 | +34.75% |
| ICICI Pru AMC | 10,602.65 | 28.19 | 2,165 | 2,874.20 | +32.76% |
| Lenskart Solutions | 7,278.02 | 16.01 | 402 | 509.35 | +26.70% |
| Groww Ltd | 6,632.30 | 10.09 | 100 | 162.28 | +62.28% |
| Meesho Ltd. | 5,421.20 | 45.28 | 111 | 145.65 | +31.22% |
| NSDL Ltd | 4,010.95 | 28.84 | 800 | 832.70 | +4.09% |
| Pine Labs Ltd. | 3,900.17 | 1.81 | 221 | 161.37 | -26.98% |
| Tenneco Clean Air | 3,600.00 | 43.47 | 397 | 531.85 | +33.97% |
| JSW Cement Ltd. | 3,600.00 | 6.03 | 147 | 114.44 | -22.15% |
| Schloss Bangalore | 3,500.00 | 3.05 | 435 | 406.20 | -6.62% |
| PhysicsWallah Ltd. | 3,480.00 | 1.49 | 109 | 89.50 | -17.89% |
| Anthem Biosciences | 3,395.00 | 47.37 | 570 | 681.45 | +19.55% |
| Clean Max Enviro | 3,079.88 | 1.00 | 1,053 | 808.60 | -23.21% |
| WeWork India | 3,000.00 | 1.09 | 648 | 450.55 | -30.47% |
| Ather Energy Ltd. | 2,980.76 | 1.26 | 321 | 796.35 | +148.08% |
| Emmvee Photovoltaic | 2,900.00 | 1.02 | 217 | 223.30 | +2.90% |
| Fractal Analytics | 2,833.90 | 2.01 | 900 | 792.55 | -11.94% |
| Aegis Vopak Terminals | 2,800.00 | 1.66 | 235 | 171.89 | -26.86% |
The top 20 IPOs raised ₹1,12,634 crore between them, over 64% of all FY26 IPO fundraising. As a basket, they delivered returns of 12.07%, meaningfully better than the broader 108-IPO basket.
The performance split within the top 20:
Average subscription across the top 20 was 14.62X. Notably, 11 of these 20 received single-digit subscription. Only 3 crossed 40X. These were large issues absorbed predominantly by institutional investors, with muted retail and HNI participation.
We covered the top 15 IPOs from the first half of FY26 in detail here: Biggest IPOs of First Half of FY26: Returns, Subscriptions and Market Performance.
The broader picture across all 108 mainboard IPOs is less flattering than the top 20 alone suggests.
| Category | Count |
|---|---|
| IPOs trading above issue price | 37 |
| IPOs trading below issue price | 71 |
| IPOs delivering 100% or more returns | 4 |
| IPOs delivering over 40% returns | 10 |
| IPOs that fell more than 50% | 13 |
| IPOs that fell more than 30% | 34 |
An equal-weighted basket of all 108 IPOs would have delivered returns of approximately 7.58%.
| Subscription Band | Count |
|---|---|
| Over 100X | 4 |
| Over 50X | 23 |
| Single-digit (below 10X) | 49 |
49 out of 108 IPOs had single-digit subscription. That is a significant drop from the frenzy of FY24 and FY25 and reflects a clear tapering in HNI and retail appetite for new issues through the year.
One of the most persistent assumptions in IPO investing is that high subscription equals strong returns. FY26 challenges that directly.
| IPO Cohort | Average Subscription |
|---|---|
| Top 10 IPOs by returns | 54.2X |
| Bottom 10 IPOs by returns | 26.5X |
The gap exists. But the bottom 10 still averaged 26.5X, which most investors would consider a well-subscribed issue. Several heavily subscribed IPOs delivered poor post-listing outcomes, while some lightly subscribed ones performed well.
Subscription ratio reflects demand at the time of bidding. It does not capture valuation quality, business fundamentals, market conditions at listing, or how secondary markets behave after the initial excitement fades.
Of the 71 IPOs currently trading below their issue price, approximately 32 had actually listed at a premium on their debut day. They gave allottees a positive listing gain. They subsequently fell below even the issue price.
Pine Labs is a useful illustration. It listed at a premium on debut but has since fallen 26.98% below its issue price of ₹221. Investors who received allotment, saw a green listing day, and held on ended up worse off than if the stock had listed flat.
The pattern is not new to Indian IPO markets, but its scale in FY26 is notable. It underlines the difference between a good listing day and a good investment.
Four factors combined to create the gap between strong fundraising and weak investor returns.
Many FY26 issuers came to market riding the momentum of FY24 and FY25, when investors were willing to pay up for growth stories. As secondary markets corrected through FY26, those valuations looked harder to sustain.
Over 100 mainboard IPOs in a single year is a large volume for any market to absorb. When supply significantly outpaces available investor attention and capital, many IPOs struggle to find buyers at or above issue price post-listing.
The broader Nifty corrected significantly through much of FY26, driven by sustained FPI outflows, geopolitical uncertainty, and crude oil price shocks. FPI selling remained persistent through March 2026, and IPOs listing into a weak secondary market face an uphill battle regardless of their own fundamentals.
A significant share of FY26 IPO fundraising came through the Offer for Sale route, where proceeds go to existing shareholders rather than the company. When IPO money does not fund business growth, it can dampen post-listing enthusiasm and long-term performance.
FY26 is not a pessimistic story about IPOs as an investment category. It is a corrective story about pricing discipline and investor selectivity.
Three practical observations from the data:
For investors who want to understand what drives IPO performance more structurally, our analysis of PE-backed versus promoter-backed IPOs from FY20 to FY25 offers a useful longer-term lens.
FY26 saw 108 mainboard IPOs raise approximately ₹1,75,186 crore, making it a record year for Indian mainboard IPO fundraising.
Approximately 66%, or 71 out of 108 mainboard IPOs in FY26, are currently trading below their issue price.
Among the top 20 IPOs by issue size, Ather Energy delivered the highest returns at approximately 148% from its issue price of ₹321 to its current market price of ₹796.35.
Not consistently. The top 10 performers averaged 54.2X subscription while the bottom 10 averaged 26.5X. Subscription was one signal, not a reliable predictor of post-listing performance on its own.
A combination of aggressive valuations at issuance, high supply volume across the year, a weak secondary market driven by FPI outflows and geopolitical uncertainty, and a high OFS component in many issues all contributed to post-listing underperformance.
Around 32 of the 71 FY26 IPOs now below issue price had actually listed at a premium on their debut day before subsequently declining below the issue price. It is a reminder that a positive listing day return and a sound long-term investment are two different things.
Disclaimer: This article is for general information and educational purposes only. It does not constitute investment advice, a recommendation, or an offer to buy or sell any securities. IPO data, market prices, and return figures referenced in this article are based on publicly available information and internal analysis by Finnovate, and are subject to change. Past performance of any IPO or basket of IPOs is not indicative of future returns. Investors should not make any investment decision based solely on this article. Please consult a SEBI-registered investment adviser or qualified financial professional before making any investment decision. Investments in securities markets are subject to market risks. Please read all related documents carefully before investing.
No spam. Only new posts, simple explainers, and practical money checklists for busy professionals.
Finnovate is a SEBI-registered financial planning firm that helps professionals bring structure and purpose to their money. Over 3,500+ families have trusted our disciplined process to plan their goals - safely, surely, and swiftly.
Our team constantly tracks market trends, policy changes, and investment opportunities like the ones featured in this Weekly Capsule - to help you make informed, confident financial decisions.
Learn more about our approach and how we work with you:


No spam. Only new posts, simple explainers, and practical money checklists.
You may also like
NSE filed its DRHP on June 17, 2026. Expected IPO size ₹30,000 crore, 100% OFS, valuatio...

Tata Sons missed its RBI listing deadline. Deregistration stalled. Two Tata Trusts vice-ch...
Omnitech Engineering IPO review 2026: issue size, price band, lot size, order book, busine...
PNGS Reva Diamond Jewellery IPO review 2026: price band, lot size, business model (FOCO/FO...
Popular now
Learn how to easily download your NSDL CAS Statement in PDF format with our step-by-step g...
Learn what SIF investment means in India, SEBI rules, Rs 10 lakh minimum investment, avail...
Looking for the best financial freedom books? Here’s a handpicked 2026 reading list with...
Clear guide to mutual fund taxation in India for FY 2025–26 after July 2024 changes: equ...