
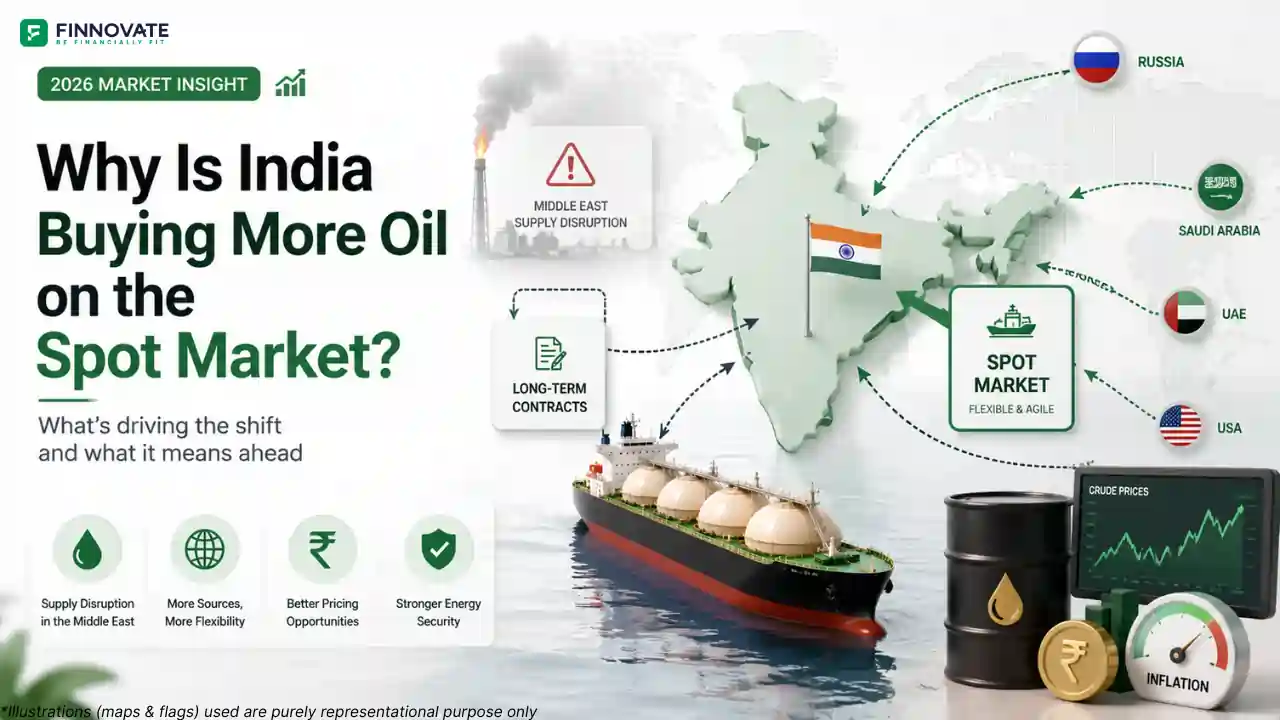
Why India Is Buying More Oil on the Spot Market After the 2026 Middle East Crisis
India's crude imports shifted fast after the 2026 Iran war. Russia's share hit 52-54% by J...
09 July 2026
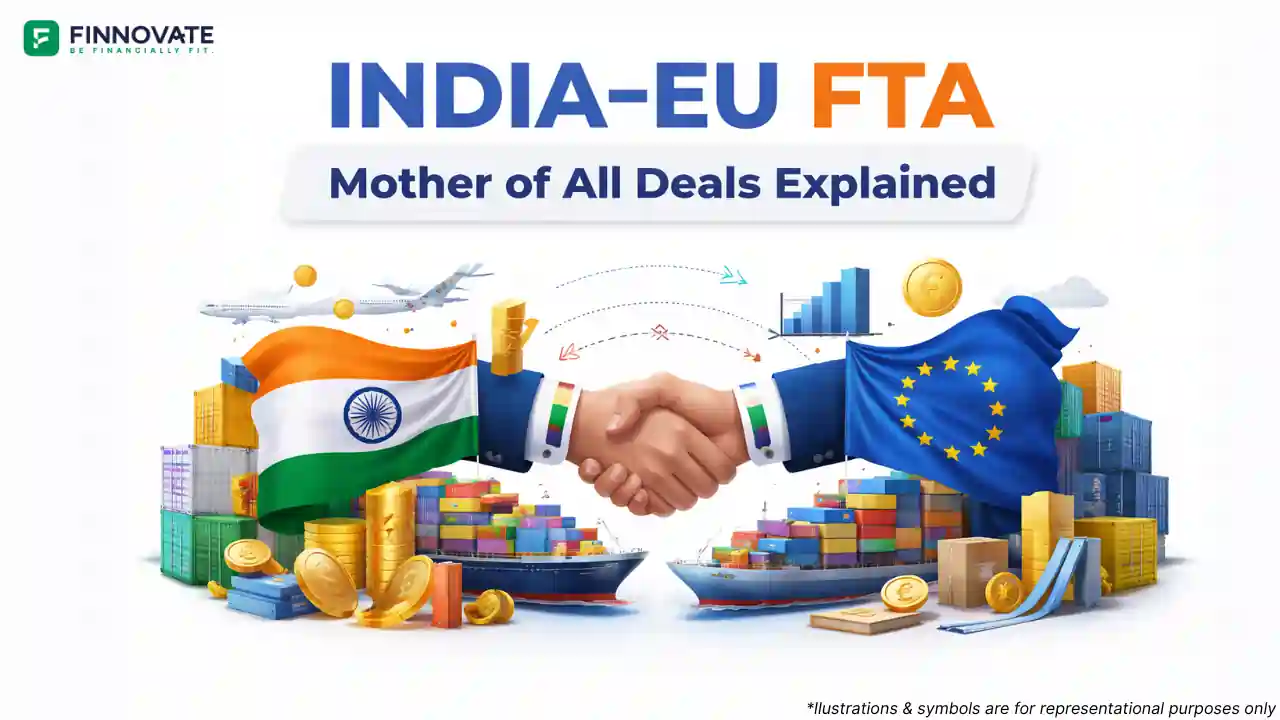
India and the European Union have concluded a Free Trade Agreement (FTA). The scale is the headline: two large markets coming under one trade framework, with wide tariff cuts spread across thousands of product lines and phased timelines.
For Indian professionals, this matters for one main reason: trade deals do not stay inside policy rooms. They show up in exports, factory orders, sector momentum, hiring, input costs, and eventually in a few consumer categories too.
| What | Number |
|---|---|
| Combined market size | ~USD 24 trillion (INR 2091.6 lakh crore) |
| People covered | ~2 billion |
| India’s goods exports to EU (2024–25) | ~USD 75.85 bn (INR 6.4 lakh crore) |
| Total India–EU merchandise trade (2024–25) | ~USD 136.54 bn (INR 11.5 lakh crore) |
| India–EU services trade (2024) | ~USD 83.10 bn (INR 7.2 lakh crore) |
| EU market access for India | 97% tariff lines covering 99.5% of trade value |
| EU tariff outcome for Indian exports | Share of tariff lines | Share of India’s exports covered |
|---|---|---|
| Duty eliminated immediately once the pact takes effect | 70.4% | 90.7% |
| Duty eliminated over 3–5 years | 20.3% | 2.9% |
| Preferential access via reductions / TRQs | 6.1% | 6.0% |
| Total preferential coverage | 97% | 99.5% (trade value) |
| India tariff outcome for EU exports | Coverage |
|---|---|
| Tariff lines offered | 92.1% |
| EU exports covered by value | 97.5% |
| Duty eliminated immediately | 49.6% of tariff lines |
| Duty eliminated in phases | 39.5% of tariff lines over 5 / 7 / 10 years |
| Phased reductions + TRQs (selected items) | 3% of products; TRQs noted for apples, pears, peaches, kiwi |
Tariff cuts do not translate into instant retail price cuts. Final pricing depends on GST, competition, and distribution margins. The early transmission is usually through business costs and order flows, not consumer shelves.
| Sector / product | India’s current exports to EU | Current EU tariff (now) | Future tariff treatment under the pact |
|---|---|---|---|
| Engineering goods | INR 1.44 lakh crore (USD 16.6 bn) | Up to 22% | Preferential market access (reductions/phase-outs apply by product lines) |
| Leather & footwear | INR 20.9 thousand crore (USD 2.4 bn) | Up to 17% | 17% → 0% once the pact takes effect, across all tariff lines |
| Marine products | INR 8,715 crore (USD 1 bn) | Up to 26% | Preferential access covering 100% of trade value, with tariff reductions up to 26% |
| Medical instruments / appliances / supplies (incl. lenses, spectacles, measuring/testing instruments) | Not specified | Up to 6.7% | Tariffs eliminated across 99.1% of trade lines |
| Gems & jewellery | INR 23.5 thousand crore (USD 2.7 bn) | Up to 4% | Preferential access across 100% of trade value |
| Textiles & apparel | INR 62.7 thousand crore (USD 7.2 bn) | Up to 12% | Zero duty access across all tariff lines, with reductions up to 12% |
| Plastics & rubber | INR 20.9 thousand crore (USD 2.4 bn) | Not specified | Preferential access (details vary by product lines) |
| Chemicals | Not specified | Duties up to 12.8% | Zero duty on 97.5% of export basket (by value) |
| Mines & minerals | Not specified | Not specified | Zero duty across 100% of tariff lines |
| Home décor / wooden crafts / furniture | Not specified | Up to 10.5% | Lower duties up to 10.5% (not described as full zero across the board) |
A combined basket of labour-intensive sectors such as textiles, apparel, marine, leather, footwear, chemicals, plastics/rubber, sports goods, toys, and gems and jewellery is sized at ~USD 33 bn (INR 2.87 lakh crore) of exports, with EU duties stated in the 4%–26% range, moving toward zero duty from the start for the covered basket.
Large FTAs usually have two parallel tracks: opening up where trade is scalable, and keeping safeguards where domestic sensitivity is high. Here, safeguards and protection are explicitly maintained for several agriculture and food segments, including dairy, cereals, poultry, soymeal, and some fruits and vegetables.
This design choice matters because it reduces the political and economic shock risk in sensitive areas while still pushing export competitiveness in manufacturing and labour-intensive categories.
If a product moves from a meaningful import duty to zero duty in a large market, it improves competitiveness even if nothing else changes. That can show up as:
Sectors with already large bases into Europe such as engineering goods and textiles are positioned to benefit from this dynamic simply because small percentage changes on large trade numbers can create a big absolute impact.
On the India side, tariff elimination is a mix of immediate and phased cuts. That structure typically creates:
Some imports can become more competitively priced over time, but the impact is uneven and often delayed because:
Where households may notice earlier effects is indirect: jobs, wage growth in export clusters, and business expansion in sectors that ramp up Europe-focused orders.
Likely beneficiaries
Likely pressure points
The announced terms point to a wide market-access shift for Indian exporters into Europe, paired with a phased opening on India’s side and explicit safeguards for sensitive food and agriculture categories. If execution stays on track, the early signals should show up in export momentum and sector-level order books first, with consumer-facing changes being narrower and slower.
Disclaimer: This content is for general information and education only. It is not investment advice, a recommendation, or a solicitation to buy or sell any security or financial product.
No spam. Only new posts, simple explainers, and practical money checklists for busy professionals.
Finnovate is a SEBI-registered financial planning firm that helps professionals bring structure and purpose to their money. Over 3,500+ families have trusted our disciplined process to plan their goals - safely, surely, and swiftly.
Our team constantly tracks market trends, policy changes, and investment opportunities like the ones featured in this Weekly Capsule - to help you make informed, confident financial decisions.
Learn more about our approach and how we work with you:


No spam. Only new posts, simple explainers, and practical money checklists.
You may also like
India's crude imports shifted fast after the 2026 Iran war. Russia's share hit 52-54% by J...
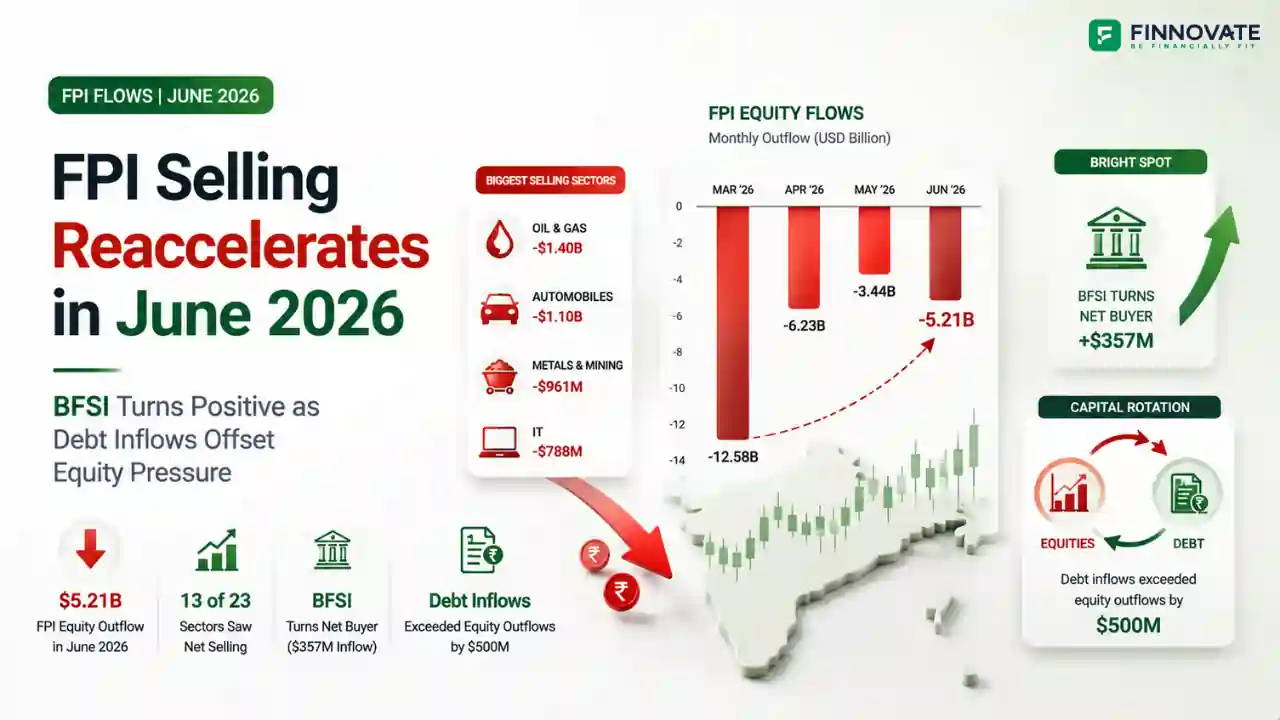
FPIs sold $5.21 billion from Indian equities in June 2026. But BFSI turned net buyer at $3...

Amazon Now is targeting 100 Indian cities with 1,000+ micro-fulfilment centres. But the re...

RBI replaced its NBFC-UL scoring system with a single ₹1 lakh crore asset test on June 2...
Popular now
Learn how to easily download your NSDL CAS Statement in PDF format with our step-by-step g...
Learn what SIF investment means in India, SEBI rules, Rs 10 lakh minimum investment, avail...
Looking for the best financial freedom books? Here’s a handpicked 2026 reading list with...
Clear guide to mutual fund taxation in India for FY 2025–26 after July 2024 changes: equ...