

Why India Is Buying More Oil on the Spot Market After the 2026 Middle East Crisis
India's crude imports shifted fast after the 2026 Iran war. Russia's share hit 52-54% by J...
09 July 2026

The Index of Industrial Production (IIP) is a critical macroeconomic indicator, offering insights into the country’s industrial health and demand trends. It measures the output of various sectors such as manufacturing, mining, and electricity. In recent years, the Ministry of Statistics and Programme Implementation (MOSPI) has started releasing IIP data faster, allowing real-time comparison with inflation and other macro indicators.
For May 2025, India’s IIP slowed to 1.23%, compared to 2.57% in April 2025, reflecting both global and domestic pressures, especially in capital expenditure and trade.
| IIP BOOSTING SECTORS | IIP (May-25) | IIP DEPLETING SECTORS | IIP (May-25) |
|---|---|---|---|
| Machinery and equipment | 11.8 | Textiles | -2.7 |
| Rubber and plastic products | 10.0 | Pharmaceuticals, medicines | -3.1 |
| Electrical equipment | 7.6 | Computer, electronic products | -3.4 |
| Non-metallic minerals | 6.9 | Beverages | -4.0 |
| Basic metals | 6.4 | Paper and paper products | -4.1 |
| Motor vehicles, trailers | 6.3 | Chemicals and products | -4.8 |
| Other transport equipment | 6.3 | Leather and related products | -4.9 |
| Tobacco products | 4.1 | Furniture | -6.0 |
| Wearing apparel | 2.4 | Printing and recorded media | -16.3 |
| Wood and products of wood | 2.1 | Other manufacturing | -16.3 |
Data Source: MoSPI
Despite a positive month-on-month (MoM) IIP reading, the year-on-year (YoY) growth remains below historical trends.
Domestic capital expenditure slowed, particularly in the private sector, excluding defence-related spending. Additionally, reciprocal tariffs disrupted global trade flows and raised input costs, further denting industrial output.
The growth in sectors such as machinery, electricals, plastics, and automobiles reflects continued resilience in domestic consumption. These sectors were less reliant on exports and helped support IIP.
On the flip side, sectors like textiles, pharmaceuticals, chemicals, and electronics - which heavily rely on exports - faced sluggish global demand and logistical barriers, leading to negative growth.
The cumulative IIP for April–May 2025 (first two months of FY26) stands at 1.8%, primarily supported by wood products, tobacco, vehicles, and electricals. Drag continues from the media, pharma, and chemical sectors.
The subdued IIP data for May 2025 signals the tightening grip of global uncertainty on India’s manufacturing and export sectors. While domestic consumption is holding ground, the weakness in export-driven industries and a contraction in electricity output are areas of concern.
Going forward, a rebound in global trade sentiment and clarity on tariff regimes will be essential for India’s industrial sector to regain momentum.
Disclaimer: This article is for informational purposes only and does not constitute financial, investment, or professional advice. Readers are advised to consult their advisors before making any financial decisions.
No spam. Only new posts, simple explainers, and practical money checklists for busy professionals.
Finnovate is a SEBI-registered financial planning firm that helps professionals bring structure and purpose to their money. Over 3,500+ families have trusted our disciplined process to plan their goals - safely, surely, and swiftly.
Our team constantly tracks market trends, policy changes, and investment opportunities like the ones featured in this Weekly Capsule - to help you make informed, confident financial decisions.
Learn more about our approach and how we work with you:


No spam. Only new posts, simple explainers, and practical money checklists.
You may also like
India's crude imports shifted fast after the 2026 Iran war. Russia's share hit 52-54% by J...
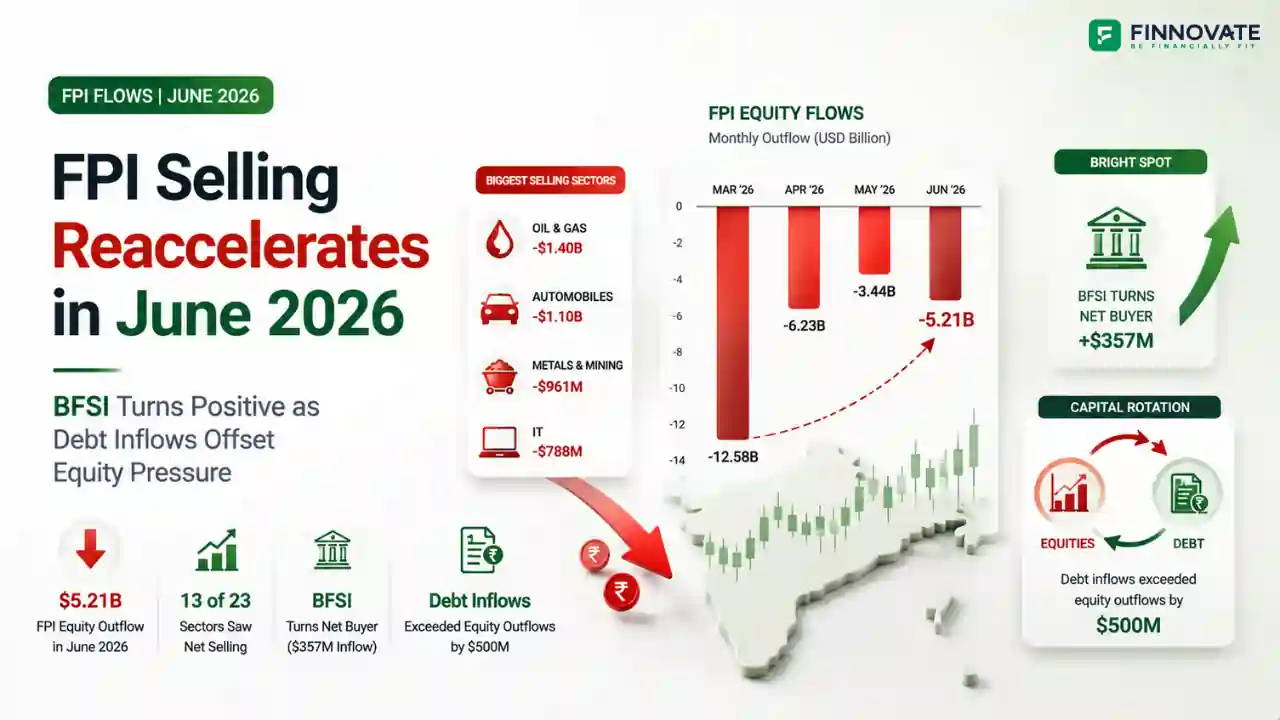
FPIs sold $5.21 billion from Indian equities in June 2026. But BFSI turned net buyer at $3...

Amazon Now is targeting 100 Indian cities with 1,000+ micro-fulfilment centres. But the re...

RBI replaced its NBFC-UL scoring system with a single ₹1 lakh crore asset test on June 2...
Popular now
Learn how to easily download your NSDL CAS Statement in PDF format with our step-by-step g...
Learn what SIF investment means in India, SEBI rules, Rs 10 lakh minimum investment, avail...
Looking for the best financial freedom books? Here’s a handpicked 2026 reading list with...
Clear guide to mutual fund taxation in India for FY 2025–26 after July 2024 changes: equ...