
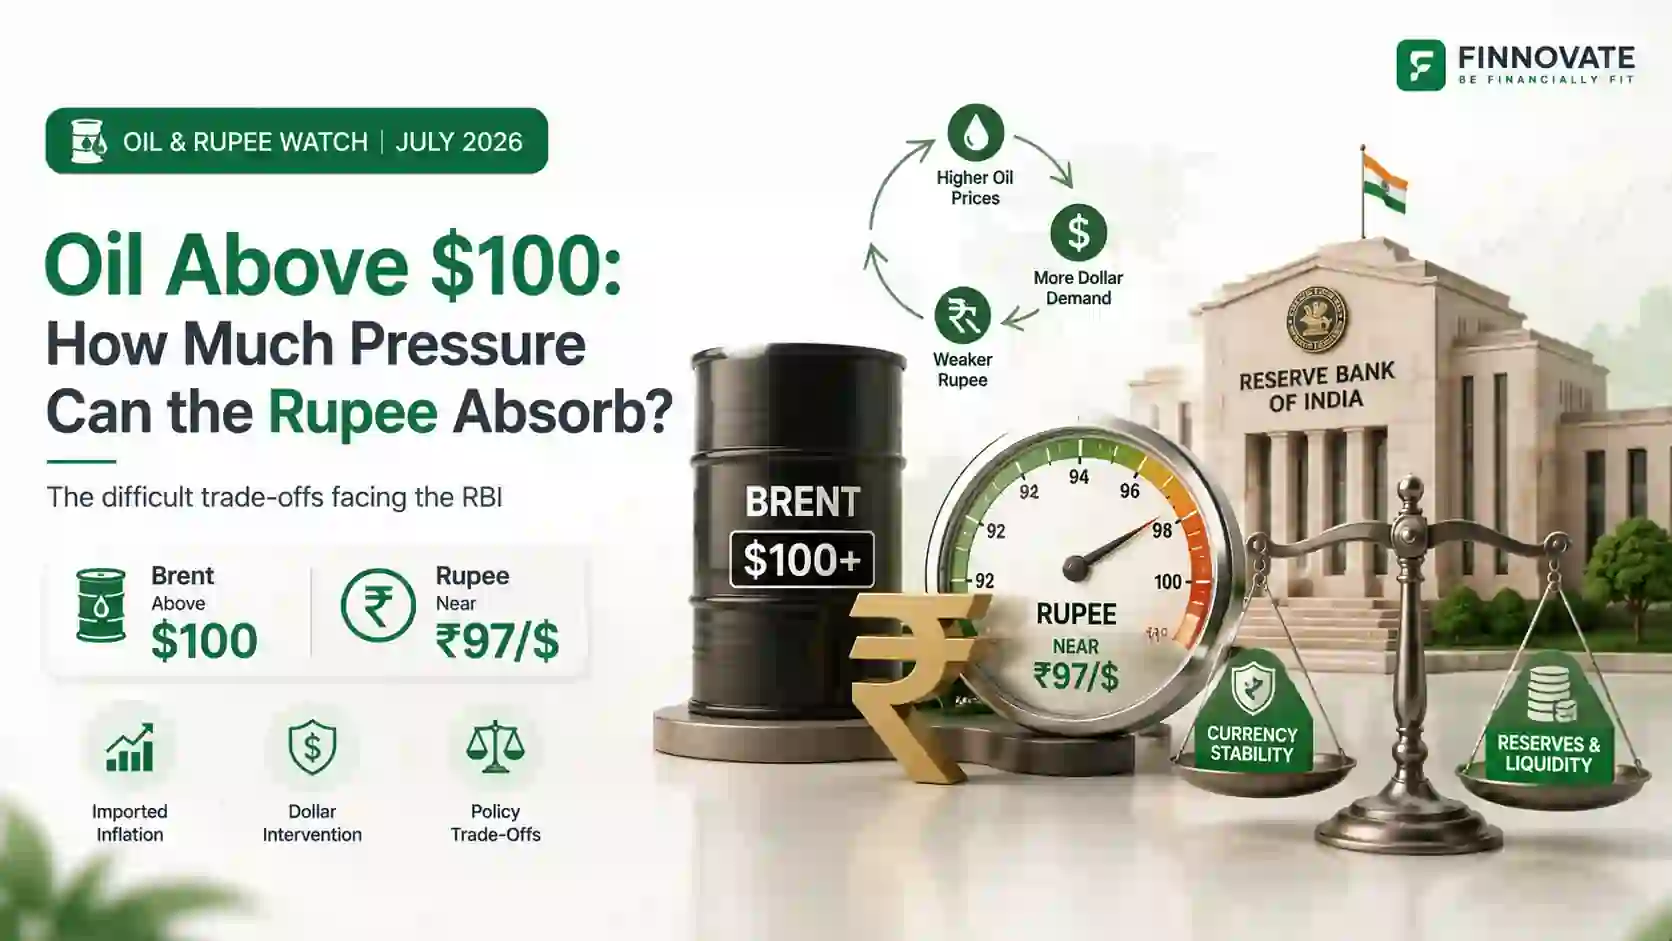
Oil Above $100: Rupee, RBI and What India Can Absorb
Brent crossed $100 on July 24, 2026. The rupee hit ₹96.80. India has $675bn in reserves ...
24 July 2026

Warren Buffett’s latest move wasn’t a flashy buy - it was a big ambivalence. Berkshire Hathaway ended Q3 2025 with roughly $382 billion parked in cash and equivalents. That’s not a casual number; it’s a message.
When the man who built his reputation buying great businesses at fair prices prefers short-term Treasuries over tech euphoria, it’s worth asking: Is Buffett simply cautious, or is he seeing something the rest of the market is ignoring?
Berkshire’s cash pile has swollen from about $142 billion in 2020 to $382 billion as of September 2025. To put that in perspective, the cash holding is roughly 135% of the company’s $280 billion equity portfolio. It’s also more than the annual GDP of several small developed economies.
Over the past three years Berkshire has been a persistent net seller in equities. There were tactical buys - after the pandemic sell-off and again in late 2021 when new-economy stocks corrected but mostly money has flowed into safe U.S. Treasuries.
That doesn’t mean Buffett is bearish on America’s long-term growth. It means he’s reluctant to pay today’s prices for tomorrow’s profits.
One simple way Buffett gauges market stretch is the Buffett Indicator - the ratio of total stock market capitalization to GDP. Today, the U.S. Buffett Indicator sits near 220%. For comparison, India’s market cap‑to‑GDP is a little above 100% - materially lower.
When the Buffett Indicator climbs above 200%, it’s historically been a cue for caution. In Buffett’s playbook, sky‑high market caps relative to economic output signal that investors might be paying for hope rather than fundamentals.
The CAPE ratio (Cyclically Adjusted P/E) is another worry. The U.S. CAPE is around 39.5x - levels similar to the 1999–2000 dotcom peak. After that peak came a multi-year correction that erased significant market value.
History shows that extreme CAPE readings are often followed by prolonged periods of weak returns. It’s this kind of statistical memory that likely nudges a value-oriented investor to hoard cash instead of hunting for bargains at frothy prices.
Contrast Buffett’s patient cash hoarding with Michael Burry’s recent aggressive positions. Burry - famous for spotting the 2007–08 subprime fault lines - placed about $1.1 billion in notional put positions against two AI‑linked names: NVIDIA and Palantir. These were reported as naked shorts rather than hedges.
That doesn’t mean Buffett and Burry agree on timing or tactics. But when a measured investor stacks cash and a contrarian places large downside bets on the frothiest names, both moves point to one conclusion: valuation risk is front and centre.
Buffett’s signal is global. Indian investors shouldn’t copy his moves mechanically - markets have local drivers - but the lessons are useful:
India’s market is not as extended as the U.S. today, but pockets of euphoria exist especially in thematic and small‑cap segments. Vigilance and selectivity remain key.
Buffett’s $382 billion is less about fear and more about discipline. When prices look like a stretched rubber band, he’d rather hold the safety net than risk the snap. For investors, that’s a reminder: sometimes the smartest trade is patience.
Disclaimer: This article is for informational and educational purposes only. It should not be treated as investment, tax, or financial advice.
No spam. Only new posts, simple explainers, and practical money checklists for busy professionals.
Finnovate is a SEBI-registered financial planning firm that helps professionals bring structure and purpose to their money. Over 3,500+ families have trusted our disciplined process to plan their goals - safely, surely, and swiftly.
Our team constantly tracks market trends, policy changes, and investment opportunities like the ones featured in this Weekly Capsule - to help you make informed, confident financial decisions.
Learn more about our approach and how we work with you:
No comments yet. Start the conversation. What would you add?
No spam. Only new posts, simple explainers, and practical money checklists.
You may also like
Brent crossed $100 on July 24, 2026. The rupee hit ₹96.80. India has $675bn in reserves ...

India has identified $51 billion of imports across 100 products for domestic manufacturing...

Over $300 billion in global drug revenue loses exclusivity by 2030. India's generic base i...

The US proposes 100% tariffs on India for buying Russian oil, down from an earlier 500%. N...
Popular now

Learn how to easily download your NSDL CAS Statement in PDF format with our step-by-step g...

Learn what SIF investment means in India, SEBI rules, Rs 10 lakh minimum investment, avail...

Looking for the best financial freedom books? Here’s a handpicked 2026 reading list with...

Clear guide to mutual fund taxation in India for FY 2025–26 after July 2024 changes: equ...