

Mutual Fund AUM May 2026: Flows Beat Price Moves Across Equity Categories
Active equity MF inflows fell 40.4% in May 2026 to ₹22,908 crore, but still drove more A...
15 June 2026
Every investor loves looking at returns. If your mutual fund shows 17% annual growth, it feels like a winner. But what if that return only came from market luck or higher risk? That’s where the Information Ratio (IR) steps in - a far more reliable way to judge how skilled your fund manager really is.
Most of us compare a fund’s returns with its benchmark index and assume that higher returns mean better performance. But in bull markets, even average fund managers can look like stars. A rising tide lifts all boats - and that can mask who’s genuinely adding value.
Moreover, some managers push for extra returns by taking on more risk. It may work for a while, but it doesn’t prove skill. That’s where the Information Ratio comes in - it filters out the noise and shows whether a fund beat its benchmark through real performance or just by chance.
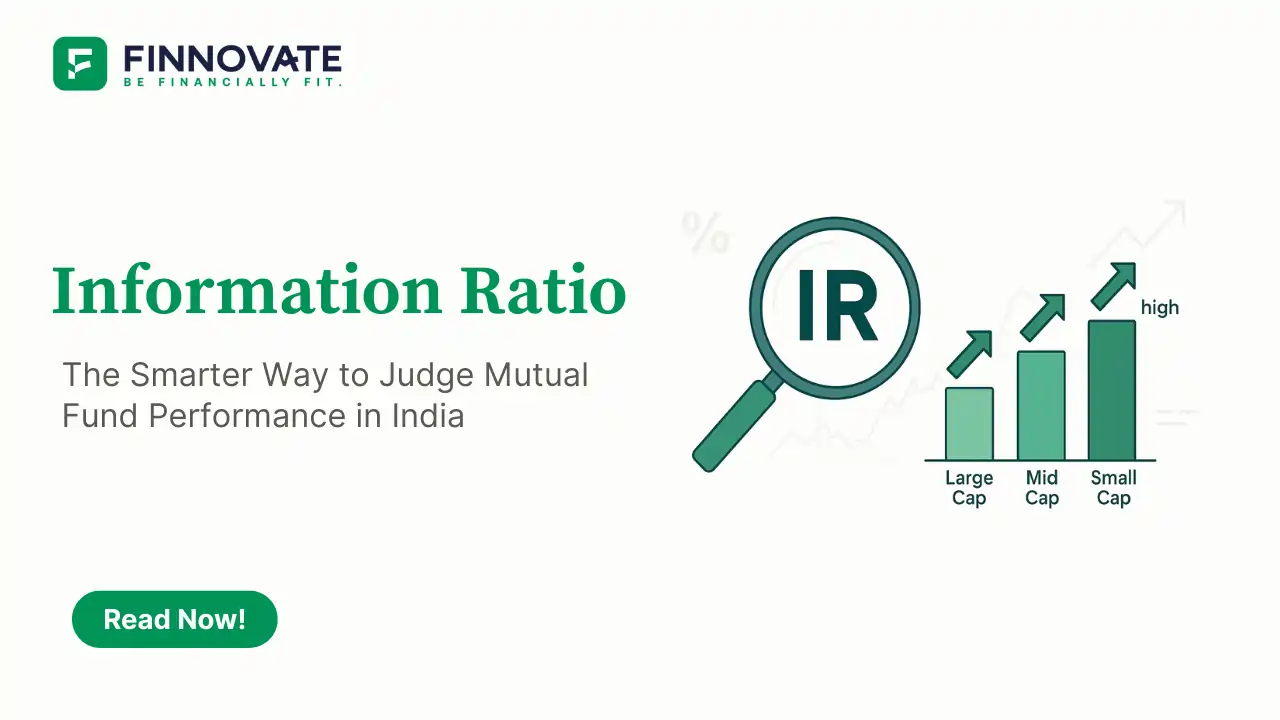
The Information Ratio measures how much excess return a fund delivers over its benchmark per unit of active risk. It tells you how efficiently the fund manager is using risk to generate returns.
The Association of Mutual Funds in India (AMFI) now publishes the IR alongside fund return data - making it easier for investors to spot genuinely skilled fund managers.
The numbers tell a surprising story. Over a decade, high-return funds don’t always have strong Information Ratios. Here’s how large, mid, and small cap equity funds stack up over 10 years:
| Category | Avg 10-Year CAGR | Funds with Positive IR (Regular Plans) | Funds with Positive IR (Direct Plans) |
|---|---|---|---|
| Large Cap | 13–14% | 2 out of 10 | 8 out of 10 |
| Mid Cap | 16–17% | 1 out of 10 | 5 out of 10 |
| Small Cap | 17–18% | 7 out of 10 | 10 out of 10 |

Large cap funds delivered healthy 13–14% CAGR over 10 years. But only 2 out of 10 had a positive Information Ratio. That means most of the so-called “top performers” didn’t truly outperform their benchmarks after adjusting for risk. Interestingly, in direct plans, 8 out of 10 funds had a positive IR - proving that lower expense ratios can make a big difference.
Mid caps have averaged 16–17% returns over 10 years, yet only 1 out of 10 top funds had a positive IR. Switching to direct plans improved efficiency - 5 out of 10 turned positive. It shows that while mid caps offer higher growth potential, most fund managers struggle to beat the benchmark consistently once you account for risk and cost.
Small cap funds have been the real outperformers. Despite higher volatility, they’ve delivered 17–18% CAGR - and 7 out of 10 funds had a positive IR. Among direct plans, all 10 showed positive IRs. That means small cap fund managers not only delivered high returns but also did so efficiently, beating what was expected of them.
No wonder many investors are shifting from expensive large cap active funds to index funds - where cost, not complexity, drives performance.
Numbers tell a story - but your goals need a roadmap. Talk to Finnovate and turn disciplined investing into lasting financial growth.
Set up my plan callThe Information Ratio is like a report card for fund managers - showing whether they earned their returns or just rode the market wave. As investors, it’s time we stop obsessing over raw percentages and start asking a smarter question: “How were those returns achieved?”
Disclaimer: This article is for educational purposes only and not investment advice. Please consult a qualified professional before making investment decisions.
No spam. Only new posts, simple explainers, and practical money checklists for busy professionals.
Finnovate is a SEBI-registered financial planning firm that helps professionals bring structure and purpose to their money. Over 3,500+ families have trusted our disciplined process to plan their goals - safely, surely, and swiftly.
Our team constantly tracks market trends, policy changes, and investment opportunities like the ones featured in this Weekly Capsule - to help you make informed, confident financial decisions.
Learn more about our approach and how we work with you:


No spam. Only new posts, simple explainers, and practical money checklists.
You may also like
Active equity MF inflows fell 40.4% in May 2026 to ₹22,908 crore, but still drove more A...

Passive fund net inflows hit just ₹362 crore in May 2026 despite 33% folio and 25% AUM g...

SIP inflows hit a record ₹32,087 crore in March 2026. Yet the stoppage ratio crossed 100...

India's household savings in equities and MFs rose from 2% to 15.2% between FY12 and FY25,...
Popular now
Learn how to easily download your NSDL CAS Statement in PDF format with our step-by-step g...
Learn what SIF investment means in India, SEBI rules, Rs 10 lakh minimum investment, avail...
Looking for the best financial freedom books? Here’s a handpicked 2026 reading list with...
Clear guide to mutual fund taxation in India for FY 2025–26 after July 2024 changes: equ...